Build a WebSite Data Dashboard from a blank canvas to learn how to create and configure a DataV visualization application.
Background information
-
The example uses Static Data, so you can directly paste the prepared data in the data configuration area of the component. If your data source is a CSV File, Database, or other types, you need to add a data source first.
-
If you need to use an API data source, you can directly enter the API address in the data configuration bar. When configuring, if you need to enable operations such as Server Proxy Request, see Configure cross-domain data.
Effect display
After completing the configuration in this article, you will have a data dashboard with the following effect.
Visualization applications involve many configurations, and different settings produce different styles. This example only introduces the basic features and workflow. Your actual results depend on your specific configuration.
Component information
The following figure shows the component checklist for this example, listing each component and its quantity.
Procedure
Build a visualization application on a blank canvas and explore the key features of DataV-Board through the following steps.
Step 1: Create a visualization application
-
Log on to the DataV console.
-
On the Projects page, click PC Creation.. On the page, select Blank Canvas and click Create Project.
-
In the Create Project dialog box, enter the visualization application name and select a project group. If no group has been created, you can select Ungrouped.
After the application is created successfully, you will be redirected to the application editor page. You can connect to data sources and configure canvas information as needed.
NoteThe default canvas size is 1920×1080. You can adjust it as needed in the Page Setting area on the right side of the canvas editor.
Step 2: Add and configure components
-
Multiple selection operation: In Windows, hold down the Ctrl key (Command key on Mac) and click components to select multiple components.
-
Move components: You can adjust the position of components in the canvas by dragging them or modifying their coordinates in the configuration panel.
-
Layer adjustment: In the layer panel on the left, you can drag components up or down to change their layer levels. When moving layers, when two components overlap, the component in the front position will cover the one in the back position.
Business indicator trend
-
In the All Assets panel on the left side of the canvas, click to add the component to the canvas.
-
Click the component, and in the Configuration panel on the right side of the visualization application, configure the Title, Icon, and Value in the bottom panel according to the effect diagram.

-
Repeat the above steps to complete the configuration of all business indicator trend components.
General title
-
In the All Assets panel on the left side of the canvas, click to add the general title component to the canvas.
-
Click the component, and in the Configuration panel on the right side of the visualization application, configure the style of the Common Title.
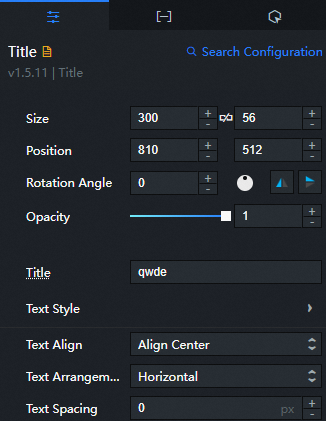
-
In the Configure panel of the Common Title tab, modify the name of the title.
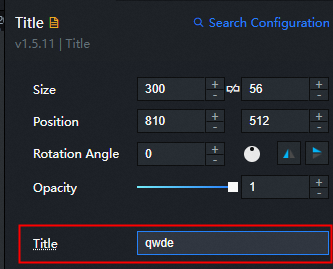
-
Repeat the above operations to continue adding other General Title components.
Ticker board
-
In the All Assets panel on the left side of the canvas, click the component.
-
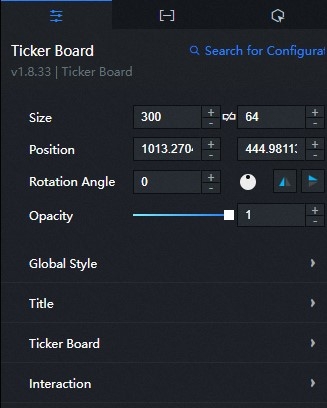
Click the component, and in the Configuration panel on the right side of the visualization application, configure the style of the Ticker Board.
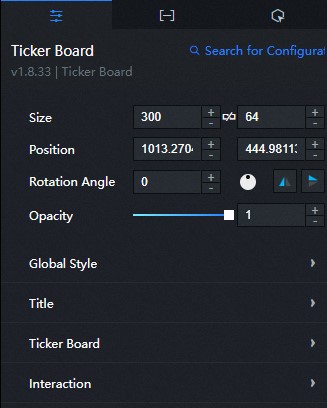
-
In the Ticker Board's Data Panel, change the value to the data you want to display.
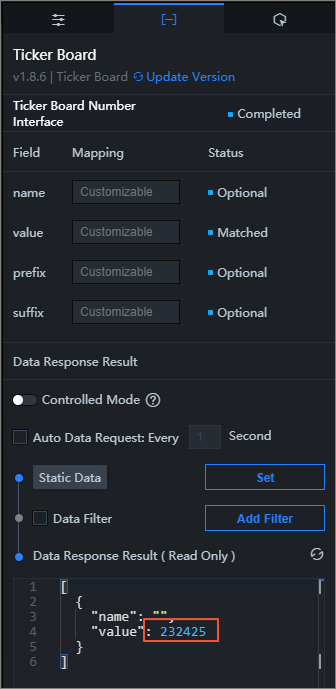
-
Repeat the above operations to continue adding other Ticker Board components.
Timer
-
In the All Assets panel on the left side of the canvas, click the component.
-
Configure the style of the Timer, modify the Icon Style, Timer, and other configurations.
Custom background block
-
In the All Assets panel on the left side of the canvas, click the component.
-
Configure the style of the Customized Background, modify the Custom Style and Custom Background Style.

Dashboard
-
In the All Assets panel on the left side of the canvas, click the component.
-
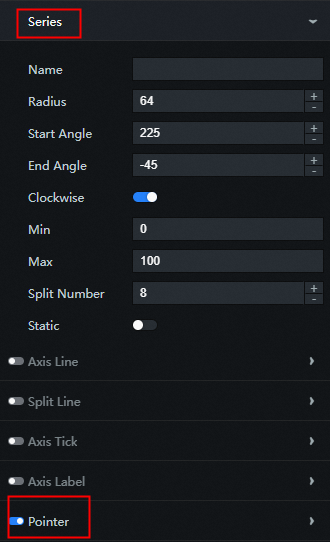
Configure the style of the Dashboard, modify fields such as Dashboard Pointer under Series.
-
Modify the data item JSON file as needed.

Annotated bubble bar chart
-
In the All Assets panel on the left side of the canvas, click the component.
-
Configure the style of the Label Bubble Column Chart,, modify the Element Style under Series and modify the data source and other configurations.


Area chart
-
In the All Assets panel on the left side of the canvas, click the component.
-
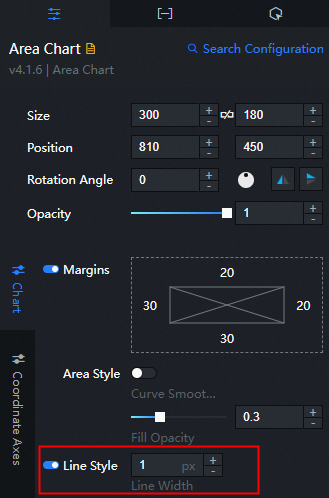
Configure the style of the Area Chart, modify the Line Style and Set Data Source.

-
Repeat the above operations to continue adding other Area Chart components.
Single image
-
In the All Assets panel on the left side of the canvas, click the component.
-
Modify the Background Image of the single image as needed.

-
Repeat the above operations to continue adding other Single Image components.
Step 3: Preview and publish the visualization application
After configuring all component styles and data sources, preview and publish the visualization application for online viewing. This section describes how to preview and publish a visualization application.
-
Click the
 icon in the upper right corner of the canvas editor to jump to a new page to preview the visualization application.
After the preview is successful, you can publish the visualization application by following these steps.
-
Click the
 icon in the upper right corner of the canvas editor, and in the dialog box that appears, click Publish Project to open the publish page.
 -
On the publish page, click the icon to the right of Sharing URL
 to copy the link.Note
On the publish page, you can perform publish information and snapshot management as needed.
-
Copy and paste the URL to the address bar of a browser to view the published project.
References
-
For more creation methods, see Create a visualization application from a template.
-
For more configuration details such as component settings and blueprint use cases, see Component configuration, Blueprint cases.