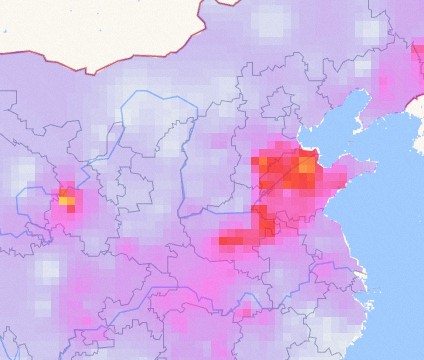
The isosurface layer is a sub-component of the basic flat map. It is suitable for making known vector point data into raster area chart for large screen display. For example, the isosurface component is used to interpolate air quality maps across the country in real time to meet the visualization requirements of some meteorological and other industries. This topic describes the meaning of each configuration items of the isosurface layer.
Settings
- Search for Configurations: In the right-side panel of Canvas Editor, click the Settings tab, and click Search for Configurations in the upper-right corner. Enter the required configuration item in the search box, and click the search icon to quickly locate the configuration item. Fuzzy match is supported. For more information, see Search for widget configuration items.
- Visibility Level: Specify the visibility level of the isosurface.
- Opacity: the transparency of the isosurface layer.
- Pixel Size: the pixel size of each grid area chart the grid. The range is 1 to 10. The smaller the pixel, the clearer the isosurface layer and the longer the rendering time. The larger the pixel, the more blurred the isosurface layer and the shorter the rendering time.
- Weights: the influence of the interpolation point on the surrounding points. The range is 0.5 to 3. The larger the weight, the greater the impact, the better the rendering effect, but the longer the rendering time.
- Rendering Type: the rendering method of the isosurface layer. The system provides two rendering
methods: Linear and Piecewise.
- Linear
Parameter Description Break Value The interrupt value for linear rendering. DataV obtains the interpolation point corresponding to the middle value value based on the interrupt value you set and the interval of the value value. The color of this point is the IntermediateValue Color you set. Fill Color The fill colors include MinValue Color, IntermediateValue Color, and MaxValue Color. - MinValue Color: The color of the interpolation point with the smallest value value. See the color picker description to modify it.
- IntermediateValue Color: The color of the corresponding interpolation point when the value value is between the maximum and minimum values.
- MaxValue Color: The color of the interpolation point with the largest value value.
Classified Colors The number of categories of interpolation points. DataV divides interpolation points into multiple categories based on the specified number of categories and the interval of value values. Each category corresponds to a different color. The more categories, the better the interpolation effect, but the longer the rendering time. - Piecewise
Parameter Description Break Value The interrupt value for linear rendering. DataV obtains the interpolation point corresponding to the middle value value based on the interrupt value you set and the interval of the value value. The color of this point is the middle color you set. Default Color The default color of the interpolation point. This default color is used when the value value of the interpolation point is not in the segment interval you set. Pieces Click the  or
or  icon on the right to add or remove a segment. Click the
  or
or  icon to configure the arrangement style of multiple segments.
- Value Range: the interval value of the segment. You can adjust the value range based on the value value range of the interpolation point in the data.
- Color: value the color of the interpolation point within the Value Range that you set.
- Linear
Data
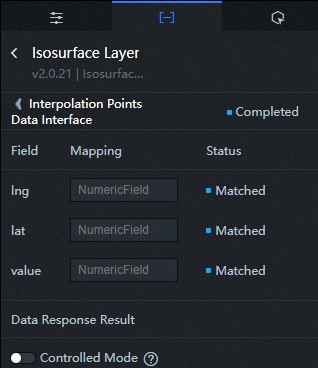
- Interpolation Points Data Interface
 For more information, see Sample JSON code.
Table 1. Parameters Log field Description lng The longitude of the interpolation point. lat The latitude of the interpolation point. value The value of the interpolation point. DataV adjusts the rendering effect of the isosurface layer based on the value value and the rendering configuration items in the configuration panel. - Clip Boundary Data Interface
For more information, see Sample JSON code.
The crop boundary defines the range of interpolation points to render. For example, in the preceding figure, the cropping boundary data defines the entire map of China with colored regions.
| Parameter | Description |
|---|---|
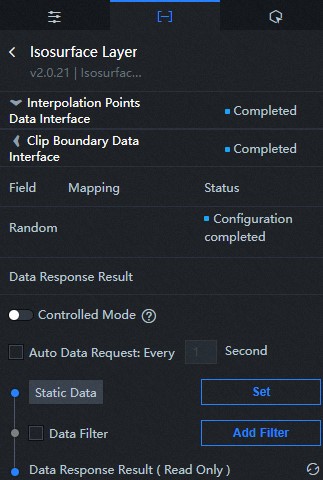
| Controlled Mode | If you turn on the switch, data is not requested when a widget is initialized. Data requests are triggered only based on callback IDs or the method configured in Blueprint Editor. If you turn off the switch, data requests are automatically triggered. By default, the switch is turned off. |
| Auto Data Request | After you select the Auto Data Request check box, you can enable dynamic polling, and manually specify the polling interval. If you do not select this check box, data is not automatically requested. You must manually refresh the page to request data or use Blueprint Editor or callback ID events to trigger data requests. |
| Data Source | In the right-side panel of Canvas Editor, click the Data tab. Click Set next to Static Data. In the Configure Datasource panel, select a data source from the Data Source Type drop-down list. Enter code for data query in the code editor, click Preview Data Response to preview the response of the data source, and then view the response. For more information, see Configure widget data. |
| Data Filter | If you select the Data Filter check box, you can convert the data structure, filter data, and perform simple calculations. If you click the plus sign (+) next to Add Filter, you can configure the script for the data filter in the editor that appears. For more information, see Use the data filter. |
| Data Response Result | The response to a data request. If the data source changes, you can click the |
Interaction
This widget does not support interaction events.
Configure interactions in Blueprint Editor
- On the Canvas Editor page, click the
 icon to the right of the Isosurface Layer in the Basic Plat Map Subcomponent Management List.
- Click the
 icon in the upper-left corner of the page.
- On the Blueprint Editor page, click the Isosurface Layer component in the Import Nodes section. On the canvas, you can view the configuration
parameters of the isosurface layer in Blueprint Editor as shown in the following figure.
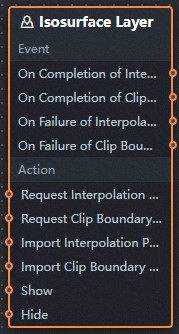
- Event
Event Description On Completion of Interpolation Points Data Interface Request The interpolation point data interface requests the events that are returned and thrown after being processed by the filter, and the processed JSON-formatted data is also thrown. For more information about specific data examples, see the Data Response Result section on the Data tab of the canvas editor. On Completion of Clip Boundary Data Interface Request The event that is returned by the clipping boundary data interface request and thrown after being processed by the filter, and the processed JSON-formatted data is also thrown. For more information about specific data examples, see the Data Response Result section on the Data tab of the canvas editor. On Failure of Interpolation Points Data Interface Request When the interpolation point data interface request fails (the request failure may be: network problems or interface errors, etc.), the event is returned and processed by the filter, and the processed JSON format data is also thrown. For more information about specific data examples, see the Data Response Result section on the Data tab of the canvas editor. On Failure of Clip Boundary Data Interface Request When a request for a clipping boundary data interface fails, the event is returned and processed by the filter, and the processed JSON-formatted data is also thrown. For more information about specific data examples, see the Data Response Result section on the Data tab of the canvas editor. - Action
Action Description Request Interpolation Points Data Interface This action is performed to request the server data again. The data sent by an upstream data processing node or layer node is used as a parameter. For example, if the isosurface layer is configured with the API data source as http://api.testand the data passed to the Request Interpolation Points Data Interface action is{ id: '1'}, the final request interface ishtp://api.test?id=1.Request Clip Boundary Data Interface This action is performed to request the server data again. The data sent by an upstream data processing node or layer node is used as a parameter. For example, if the isosurface layer is configured with the API data source as http://api.test, and the data passed to the Request Clip Boundary Data Interface action is{ id: '1'}, the final request interface ishttp://api.test?id=1.Import Interpolation Points Data Interface After data of a widget is processed in accordance with its drawing format, the widget is imported for redrawing. You do not need to request server data again. For more information about specific data examples, see the Data Response Result section on the Data tab of the canvas editor. Import Clip Boundary Data Interface After data of a widget is processed in accordance with its drawing format, the widget is imported for redrawing. You do not need to request server data again. For more information about specific data examples, see the Data Response Result section on the Data tab of the canvas editor. Show A widget is shown without the need to specify parameters. Hide A widget is hidden without the need to specify parameters.
- Event