The schedule resource dashboard shows how Dataphin cluster scheduling resources are allocated and consumed. View and analyze global resource allocation and individual task resource assignments to improve utilization, reduce costs, and prevent task backlogs caused by resource shortages.
Prerequisites
Contact the Dataphin deployment team to deploy Prometheus monitoring and collect monitoring data before you use the schedule resource dashboard.
In the metadata warehouse tenant, ensure that the schedule resource dashboard toggle is enabled in Management Hub > Resource Settings > Resource Monitoring. For details, see Resource Monitoring.
Permissions
Only super administrators, system administrators, and custom global roles with the Development – Modify Default Cluster for Resource Dashboard permission can change the default cluster displayed in the schedule resource dashboard.
Features
-
The schedule resource dashboard analyzes Dataphin cluster scheduling resources from two perspectives: resource allocation and resource consumption, focusing on CPU and memory metrics. Tasks with low utilization (risking waste) or high utilization (risking out-of-memory errors) appear in the Suggested Optimization Tasks list for quick identification and resolution.
-
The dashboard has three sections: resource allocation, resource consumption, and suggested optimization tasks. Use snapshot values to identify blocking tasks that consume excessive resources, or review trends over time to find opportunities to improve utilization.
Data Statistics Frequency
Data is collected once per minute. For allocated resources, the dashboard uses the current snapshot value. For consumed resources, it uses the peak value over the past minute. Each page refresh updates the displayed data.
Access the Schedule Resource Dashboard
-
On the Dataphin homepage, click Development in the top menu bar, and then click Task O&M.
-
In the left navigation pane, click Overview, and then click Schedule Resource Dashboard to open the Schedule Resource Dashboard page.
Tenant Resource Dashboard Overview
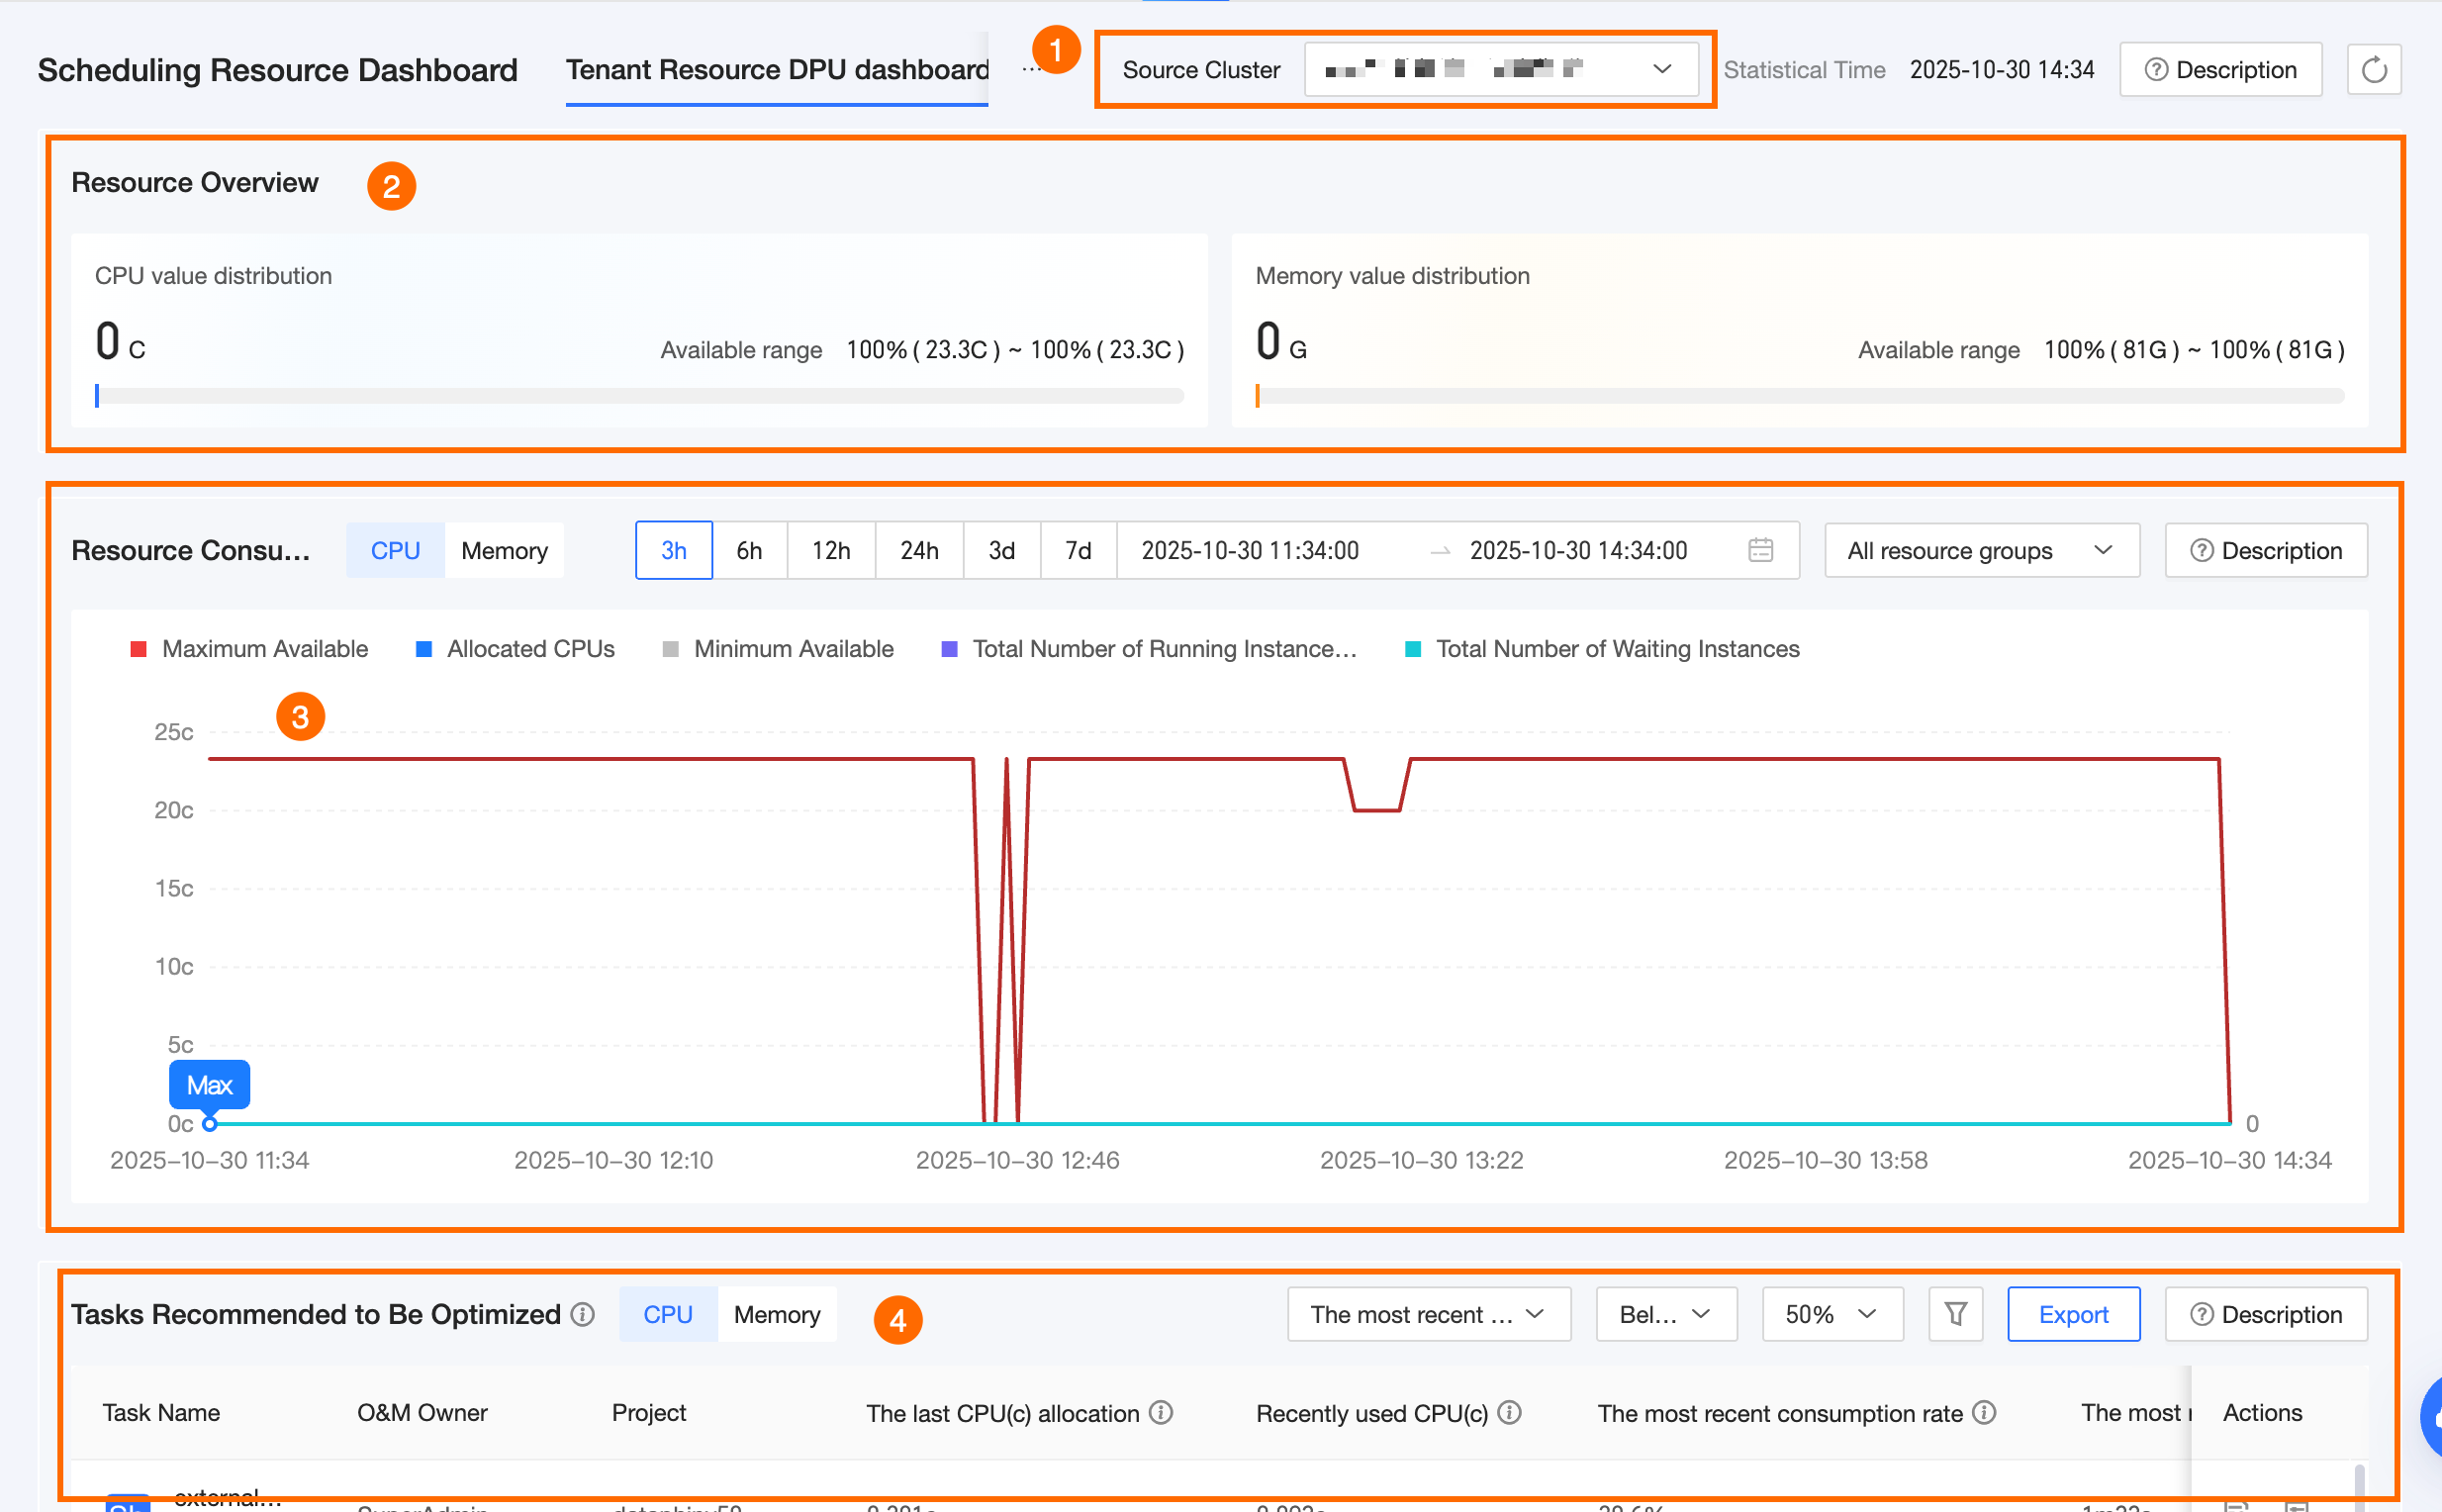
The tenant resource dashboard is not supported for Dataphin instances running on Mesos architecture.
|
Section |
Description |
|
①Source Cluster |
By default, the default scheduling cluster is selected. You can switch to any cluster where metric collection is enabled and status is Normal. You can also change the default cluster shown in the schedule resource dashboard. |
|
②Resource Overview |
Summarizes resources allocated to the selected source cluster, including CPU Allocation and Memory Allocation.
Note
For Dataphin instances running on Kubernetes architecture, if custom resource groups are not supported, only CPU and memory allocation values appear. |
|
③Resource Consumption |
Shows CPU and memory consumption for the tenant within the selected time range and resource group.
Note
For Dataphin instances running on Kubernetes architecture, if custom resource groups are not supported, the resource group filter is unavailable and the chart does not show available upper and lower limits. |
|
④Suggested Optimization Tasks |
Lists suggested optimization tasks for the tenant, grouped by CPU and memory. Only recurring tasks in the production environment that use the selected scheduling cluster are included. Shared-container tasks such as SQL tasks are excluded. Each task shows:
Use filters in the top-right corner to find specific tasks:
Click Export in the top-right corner to export the filtered task list to Excel. For the Last 7 Consumption Values column, values appear in one cell, separated by commas (,). |
Suggested Optimization Tasks: Recommendations
-
If a task allocates far more resources than it consumes and runs for a long time, monitor it closely. It may delay ad hoc queries or downstream business operations.
-
If a task allocates far more resources than it consumes and runs for a short time, monitor it. You can reallocate unused resources to other tasks facing resource shortages.
-
If a task’s resource consumption approaches its allocation, monitor it. Low headroom may cause delays or failures.
-
If a task’s memory consumption reaches or exceeds 100%, monitor it closely. Increase its memory allocation to avoid out-of-memory errors and failed runs that affect data output.
Cluster Resource Dashboard Overview
|
Section |
Description |
|
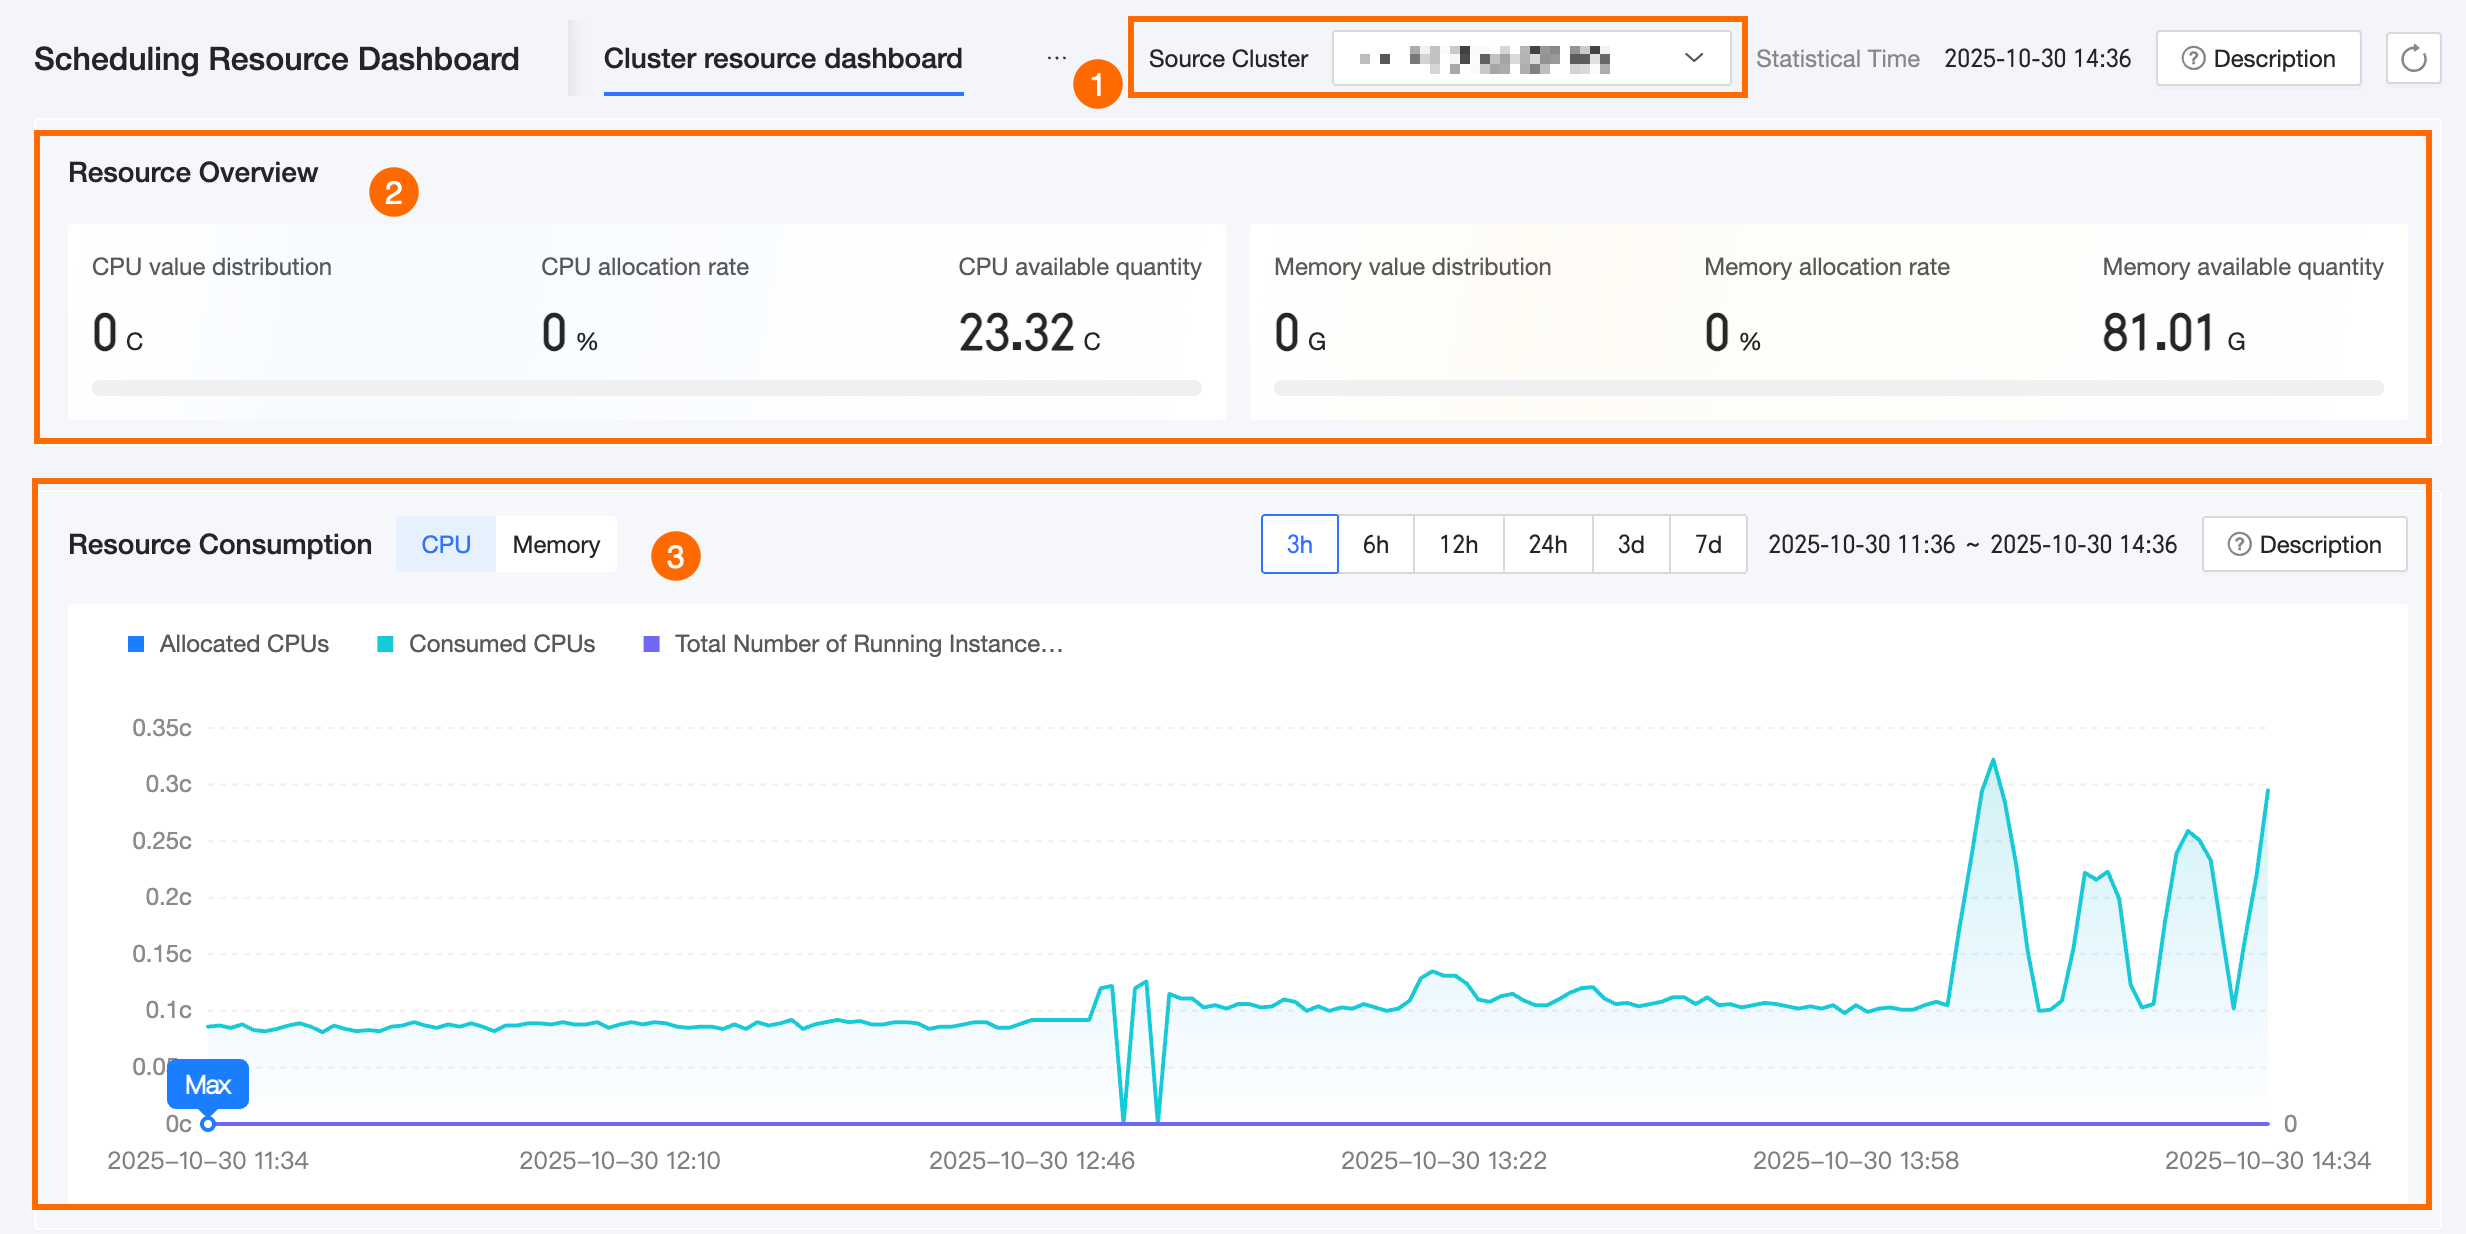
①Source Cluster |
By default, the default scheduling cluster is selected. You can switch to any cluster where metric collection is enabled and status is Normal. You can also change the default cluster shown in the schedule resource dashboard. |
|
②Resource Overview |
Summarizes resources allocated to the selected source cluster, including CPU Allocation and Memory Allocation.
|
|
③Resource Consumption |
Shows CPU and memory consumption for the default scheduling cluster.
|
|
④Suggested Optimization Tasks |
When consumption and allocation diverge significantly, use the Suggested Optimization Tasks list to find tasks with low consumption rates and adjust their resource configurations to improve utilization. For details, see Suggested Optimization Tasks and Suggested Optimization Tasks: Recommendations. Note
Only Dataphin instances running on Mesos architecture support suggested optimization tasks. |