DataService Studio monitors API runtime status to help you ensure normal API calls, protect system stability, and handle abnormal metrics promptly.
Limits
-
When the API gateway you use has not enabled log collection, failed gateway calls will not be included in call statistics, and logs of failed calls cannot be collected. We strongly recommend configuring log collection for the gateway to collect complete log information .
-
Abnormal analysis and access trend analysis automatically switch between 1-minute and 5-minute statistical logs based on availability, with the system prioritizing 1-minute call statistics.
O&M monitoring entry
-
In the top menu bar of the Dataphin home page, select Service > API O&M.
-
In the left navigation bar, click Service Monitoring to access the Service Monitoring page.
-
On the Service Monitoring page, view O&M monitoring data for the selected project within a specific time range. In the upper-right corner, select the service project and time range. Supported time ranges include Last 10 Minutes, Last 24 Hours, Last 7 Days, and Custom (up to the last 90 days).
View the maintenance dashboard
-
On the Service Monitoring page, click the Maintenance Dashboard tab in the top menu bar.
-
You can view an overview of O&M data for synchronous and asynchronous calls. The O&M metrics are the same for both call types. If only one call type is supported, the system indicates this.
Overview data
Description
API count core metrics
Published APIs
The total number of APIs published to the marketplace within the specified service project.
Online APIs
The total number of APIs that have been authorized to applications and published within the specified service project.
Called API Count
The number of APIs called within the specified service project during the specified time period.
Exceptional APIs
The total API call duration divided by the total number of API calls within the specified service project during the specified time period.
API call count core metrics
API Call Count
The total number of API calls within the specified service project during the specified time period.
Abnormal Call Count
The total number of API call errors within the specified service project during the specified time period.
Abnormal Call Rate
The total number of API call errors divided by the total number of calls multiplied by 100% within the specified service project during the specified time period.
Offline Abnormal Count
The total number of API call errors returning offline errors within the specified service project during the specified time period.
Offline Abnormal Rate
The total number of API call errors returning offline errors divided by the total number of calls multiplied by 100% within the specified service project during the specified time period.
Public API Calls
This metric is only available for asynchronous calls. The number of public API calls within the specified service project during the specified time period, counted at the project level. The dependent public APIs are as follows:
-
GetJobRequestStatus: Obtains the execution status of an API call.
-
GetJobRequestResult: Obtains the result of a request returned after an API call.
-
GetJobExecutionLog: Obtains the execution log of an API.
-
CloseJobRequest: Completes an API query request.
-
CancelJobRequest: Cancels an API query request.
-
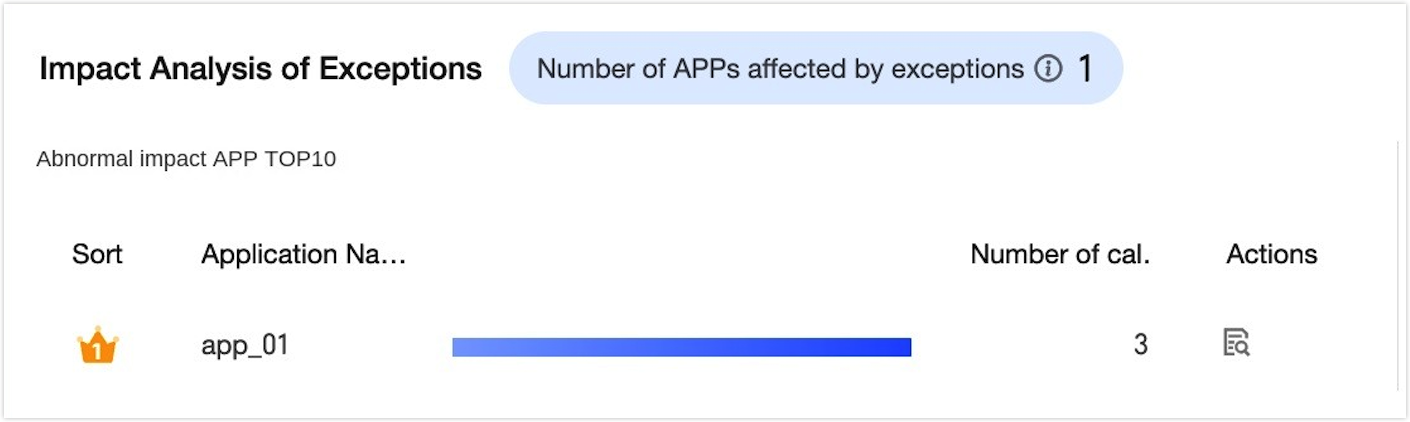
View abnormal impact analysis
View the number of apps affected by abnormal API calls for a specified service project and time period. This analysis covers both synchronous and asynchronous calls. For more information, see Application call analysis.
This section displays the Top 10 Apps Affected by Abnormalities and Top 10 APIs by Abnormal Call Count for all APIs in the selected service project. If call detail logs are enabled in the system configuration, you can also click View Call Details in the Actions column to go to the DataService Studio > API O&M > Call Logs page to view the log details for the selected time range.

View access trend analysis
Access trend analysis includes Exception Trend and Impact Trend. You can switch between 1-minute and 5-minute summary data. Hover over the chart to view call count and abnormal call count at a specific time point.
-
Exception Trend: Displays the total number of calls and the number of abnormal calls for APIs in the selected project.
-
Impact Trend: Displays the number of abnormal API calls and the number of affected applications in the selected project. This helps you identify and address issues with abnormal APIs and applications.

Public API trend analysis
Public API trend analysis is available only for asynchronous call mode. It includes Trend Analysis and Abnormal Trend Analysis. You can switch between 1-minute and 5-minute summary data. Hover over the line chart to view public API call counts at a specific time point.
-
Trend Analysis: Shows the number of public API calls in the current project.
-
Abnormal Trend Analysis: Shows the number of abnormal public API calls in the current project, helping you identify and handle public APIs with call abnormalities.

View API operation status
-
On the Service Monitoring page, click the API Operation Analysis tab.
-
The API operation status displays information by API dimension, including API name and ID, service project, call mode, number of authorized applications, call count, abnormal call count, average call duration, error rate, offline percentage, creator, and last call time.
-
You can perform the following operations on the target API.
-
API impact analysis: View information about all applications (APPs) that call this API. For more information, see API impact analysis.
-
Throttling settings: You can only configure throttling settings for APIs in the development environment of your project to prevent scenarios such as insufficient resource allocation. For more information, see Throttling settings.
-
Alert settings: You can configure alert settings for APIs in your project to receive API operation abnormality information promptly and respond quickly. For more information, see Alert settings.
-
View call logs: If call detail logging is enabled in the system configuration, you can click View call logs in the Actions column to go to the DataService Studio > Service Management > Call Logs page and view log details for the selected time range.
-

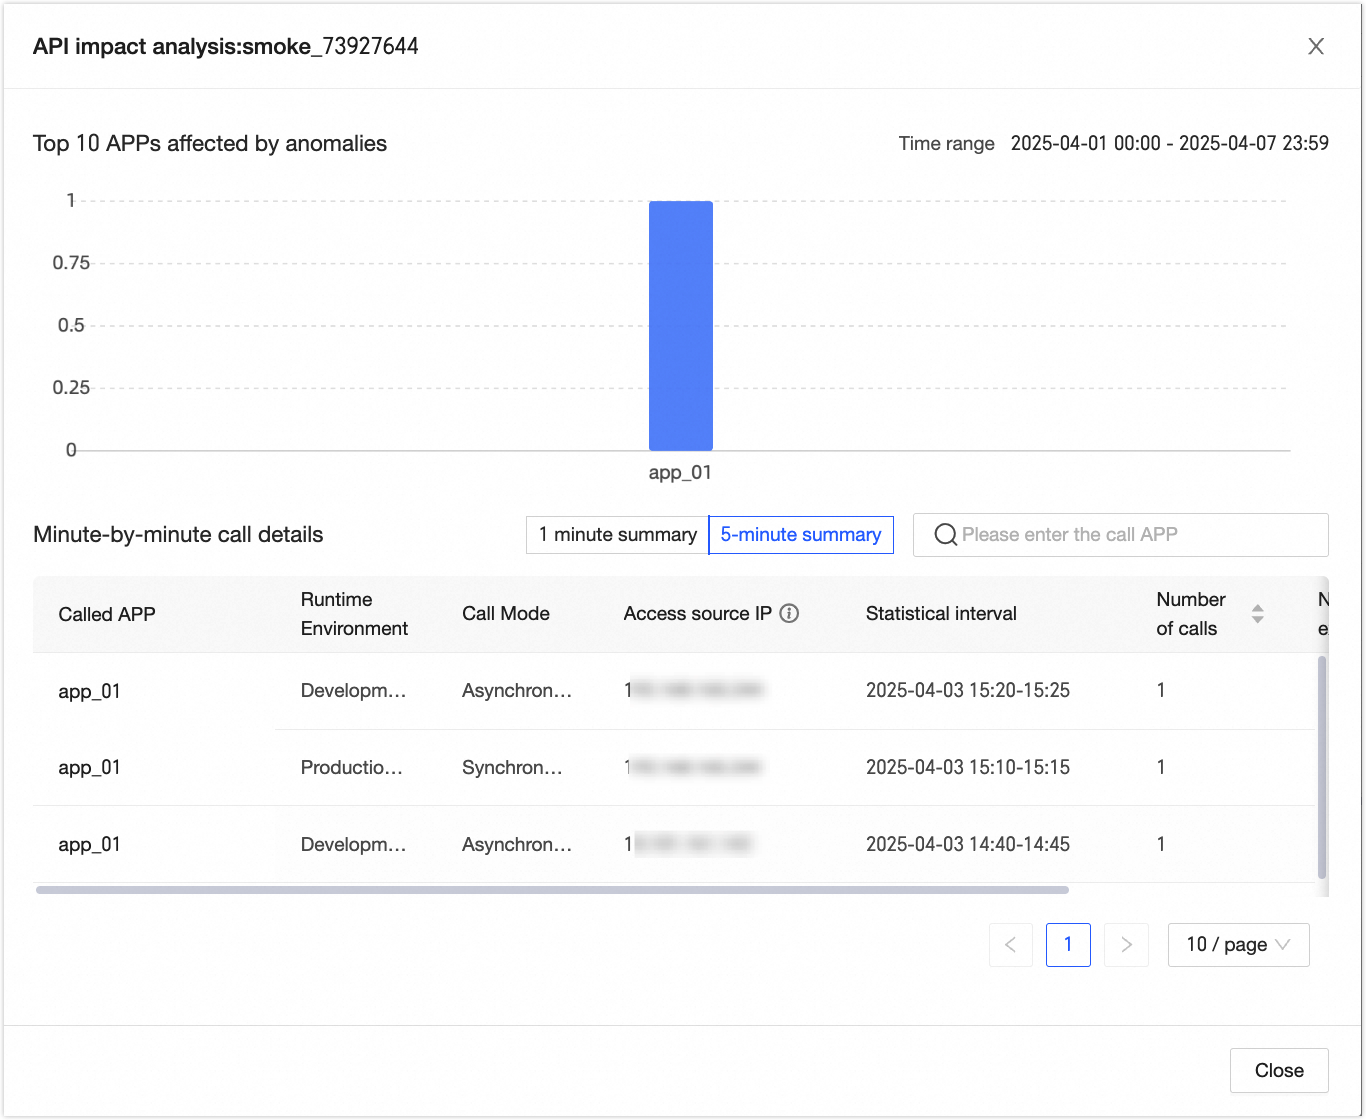
API impact analysis
-
In the API Operation Status list, click API Impact Analysis in the operation column of the target API.
-
In the API Impact Analysis dialog box, you can view information about all applications (APPs) that call this API, including APP name, source IP address, statistics interval, call count, abnormal count, and error rate. A column chart also shows the Top 10 applications affected by abnormalities.
-
Source IP address: Only includes the top 10 IP addresses with the most calls during the statistics period.
-
View call logs: This operation is supported when call detail logging is enabled in system configuration. Click View call logs after the abnormal count to go to the DataService Studio > O&M > Call Logs page to view log details for the selected time range.
-