Database Autonomy Service (DAS) provides the SQL optimization technology that can be used to automatically detect and analyze slow queries in databases and identify inefficient SQL statements. The SQL optimization technology thoroughly analyzes the execution plans of these problematic SQL statements and provides optimization suggestions or directly optimizes problematic SQL statements. The suggestions include rewriting SQL statements and adjusting the use of indexes. This way, the query time is reduced and resource consumption is lowered.
Background information
Most database administrators (DBAs) and application developers have requirements of SQL optimization. SQL statements executed on databases are diversified. In addition, SQL statements continuously change in a dynamic way in scenarios such as rapid business iteration, changes of data distribution characteristics, hot spot changes, and database version updates. Therefore, a large amount of labor and material resources are required for SQL optimization.
Challenges
Accuracy: An exception detection mechanism must be constructed to accurately identify the optimization time and accurately identify problematic SQL statements.
Professional diagnostics: Powerful professional diagnostics and optimization must be available to support the goal. If valid professional diagnostics is unavailable, SQL optimization cannot be implemented.
Security: Everything online is important. Online changes must be secure and controllable.
Comprehensiveness: Comprehensive multi-dimensional tracking and comprehensive real-time assessment of the optimization performance are also required to ensure security.
Linkage: Sometimes, complex online issues, such as malicious slow queries that abruptly occur, need to be comprehensively resolved. Therefore, the automatic SQL throttling and automatic SQL optimization features of DAS must be linked to address both the symptoms and root causes of these issues.
Scale: A service architecture that provides sufficient scalability must be built to support automatic SQL optimization for hundreds of thousands of or even millions of servers.
Issue risks
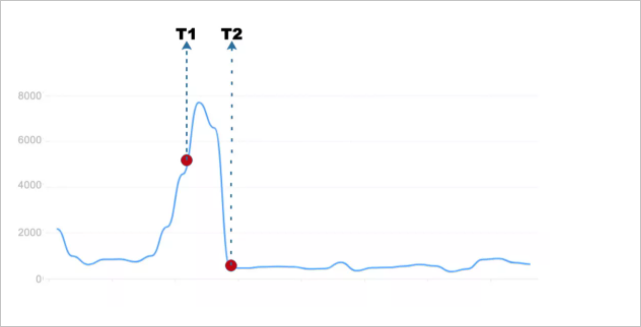
Two important points in time are considered. The following figure shows a simple trend of a slow query. T1 represents the point in time at which the performance exception of the database instance is detected and the slow query starts to be optimized. T2 represents the point in time at which the optimization process is complete and the instance recovers to the normal state. During traditional optimization, this process entirely depends on manual operations. This has the following serious weaknesses:
T1 is much later than the expected time. This indicates that the exception is not detected or responded at the earliest opportunity. Even if the exception is detected, it may have existed for an extended period of time and have been on the edge of failure.
The time difference between T2 and T1 represents the duration of the optimization process. A long processing duration seriously affects user experience and greatly increases the risks of failure.
In addition to the preceding two issues, the following greater challenges are faced:
How do I achieve continuous optimization? Detect issues and optimize SQL statements at the earliest opportunity to prevent issues from being accumulated. This ensures both the stability and the continuous optimal status of database instances.
How do I shorten the processing duration, minimize the impact, and use comprehensive methods to ensure the stability of database instances and resolve both symptoms and root causes?
The traditional optimization process that depends on manual operations is fault-driven and is incapable of coping with a large number of issues. As the business develops and the amount of data increases in database instances, all issues are magnified. Even if manpower is increased, the issues cannot be resolved. This forms a vicious cycle.
Solutions
Automatic SQL optimization is a core feature of Alibaba Cloud DAS. It offers self-optimization that is the autonomous capability to achieve the closed loop of SQL optimization. The following figure shows the closed-loop capability provided by automatic SQL optimization.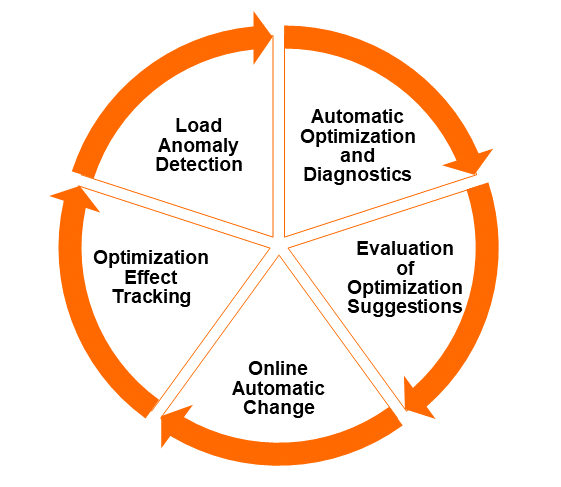
Automatic SQL optimization detects workload exceptions, identifies database business changes, and identifies problematic SQL statements such as new SQL statements that cause slow queries, SQL statements whose performance deteriorates, and inefficient SQL statements.
For problematic SQL statements, automatic SQL optimization automatically uses the SQL diagnostics and optimization feature of DAS to generate optimization suggestions, such as creating optimal indexes, rewriting SQL statements, and recommending engines.
Automatic SQL optimization automatically assesses the risks of optimization suggestions. It automatically generates a canary release plan and automatically orchestrates optimization tasks based on the workload and profile of database instances.
Automatic SQL optimization automatically selects the O&M time window, and completes relevant online changes by using the generated canary release plan. In this case, indexes can be automatically changed and released.
Automatic SQL optimization tracks the optimization performance of released changes from multiple dimensions to continuously and comprehensively assess performance regression risks in real time. If the assessment result is as expected, optimization benefits are automatically calculated. If the assessment result is not as expected, the changes are automatically rolled back.
Manpower-intensive passive optimization is transformed into intelligence-based active and continuous optimization based on the closed loop of automatic SQL optimization. This eventually achieves unattended SQL optimization. The closed loop of automatic SQL optimization works like a group of database experts who provide a 24/7 guarding service to take care of your databases. In addition, they keep your database system running in the optimal optimization state.
Architecture
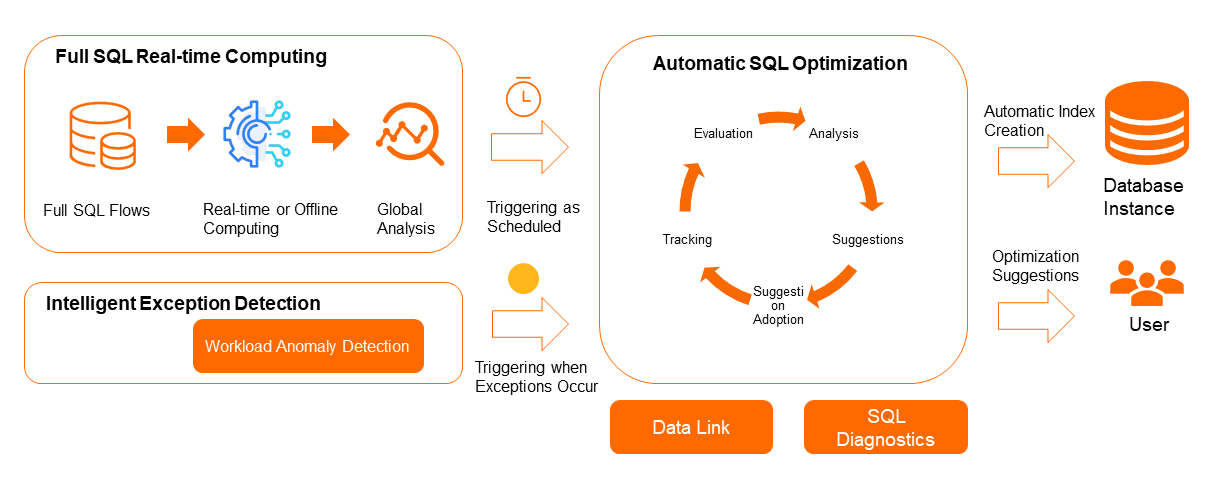
Automatic SQL optimization of DAS is a data-driven closed loop. The preceding figure illustrates the entire process in a simple way.
Exception events: Exception events are the fuse for triggering automatic SQL optimization. The DAS event center allows you to perform centralized management on exception events. Exception events are generated in the alerting system or in scenarios such as real-time exception detection, offline analysis, and workload detection.
Diagnostics: After an exception event is received from the event center, automatic SQL optimization performs preliminary diagnostics for the database instance and sends a diagnostics request to the diagnostics engine. Then, automatic SQL optimization processes the diagnostics result that contains one or more suggestions. After the result is processed, automatic SQL optimization completes an effectiveness assessment, generates a new optimization event, and then sends the event to the event center to drive the subsequent optimization process.
Suggestion push: When you enable the autonomy service in the DAS autonomy center, you can choose whether to accept optimization suggestions. The subsequent automatic optimization process can be triggered based on your settings.
Change release: DAS issues change commands in the O&M time window and checks the status of the commands.
Performance tracking and measurement: When the optimization suggestions take effect, the decision engine starts a tracking task to track the performance of optimized SQL statements and related SQL statements. If the performance deteriorates, the SQL statements are automatically rolled back. In general, if no rollback occurs after the performance is tracked for 24 hours, optimization benefits are calculated.
Issue detection
SQL optimization allows you to detect SQL exceptions in the following scenarios:
SQL optimization is regularly triggered. In a regular O&M time window, slow queries executed on your database instances are regularly analyzed offline to trigger SQL optimization.
SQL optimization is triggered when the performance of some SQL statements deteriorates. When the workload exception detection algorithm detects SQL statements whose performance deteriorates in real time, automatic SQL optimization is triggered. For complex online issues, the automatic SQL optimization and automatic SQL throttling features of DAS need to be linked to trigger automatic SQL optimization.
SQL optimization is triggered when the database workload changes. When business SQL statements are published or unpublished, the workload and data volume of your database instances change, and the existing indexes cannot meet the performance requirements of your business. In this case, diagnostics and optimization are triggered.
Diagnostics capability
The SQL diagnostics and optimization feature of DAS provides powerful support for automatic SQL optimization. This feature processes optimization issues by using the cost-based model in the same way as the database optimizer. In the end, the feature implements a quantitative assessment on all the possible recommendation options based on the execution cost and makes reliable recommendations.
The SQL diagnostics and optimization feature has been stably running in Alibaba Group for years. The feature can diagnose about 50,000 SQL statements per day, and supports SQL optimization for business applications in the entire group. The success rate of SQL diagnostics has remained more than 98%, and the recommendation rate for slow queries has remained more than 75%.
Security changes
A security change involves the security check before the change, the canary release policy, and performance tracking after the change.
Security check: To reduce risks, changes occur only in the O&M time window. In addition, changes occur only when each metric value of the replication latency between the primary and secondary databases, database workload, and tablespace is within the secure range.
Canary release policy: For example, when sharding involves a large amount of data, a canary release plan is automatically generated to implement changes in batches. This reduces risks. During the change process, the system monitors the replication latency between the primary and secondary databases. When the latency exceeds the specified threshold, the system immediately suspends the index change tasks of each database and ensures that only one change task is run for each database.
Performance evaluation: The performance evaluation algorithm tracks the performance of optimized SQL statements and related SQL templates to prevent failures that are caused by the deteriorated performance. The performance evaluation algorithm compares the performance metrics of an SQL template before the optimization with those after the optimization by using the decision tree model. This algorithm comprehensively determines whether the performance of the SQL template deteriorates at a specific time. This algorithm tracks full SQL statements and SQL statements that cause slow queries. Business changes occur on a daily basis. The default tracking cycle is 24 hours. If no rollback occurs, the optimization is successful and the actual optimization benefits are calculated.
Supported database engines
Automatic SQL optimization supports the following database engines: ApsaraDB RDS for MySQL, PolarDB for MySQL, and ApsaraDB RDS for PostgreSQL.