Database Autonomy Service (DAS) provides the monitoring dashboard feature. DAS allows you to specify database instances and metrics to monitor and compare the metrics of the database instances. You can also configure metric linkage. This helps you understand the status of database instances.
Prerequisites
The database instance that you want to manage is one of the following types:
ApsaraDB RDS for MySQL, self-managed MySQL, and PolarDB for MySQL
Tair (Redis OSS-compatible) and self-managed Redis
ApsaraDB for MongoDB and self-managed MongoDB
ApsaraDB RDS for PostgreSQL
ApsaraDB RDS for SQL Server
The database instance that you want to manage is connected to DAS and is in the Accessed state. For more information about how to connect a database instance to DAS, see the following topics:
Create a monitoring dashboard
Log on to the DAS console.
In the left-side navigation pane, choose Intelligent O&M Center > Monitoring Dashboard.
On the Custom Dashboard page, click a tab to select a database engine.
On the tab for the specified database engine, click Add Monitoring Dashboard.
In the Create Monitoring Dashboard dialog box, set Dashboard Name and then click OK.
Click Select Metrics and Instances. In the Select Metrics and Instances dialog box, select the instances that you want to monitor and the metrics that you want to view. Then, click
 . Note
You can select up to 32 instances at a time.
For more information about monitoring metrics, see Metrics.
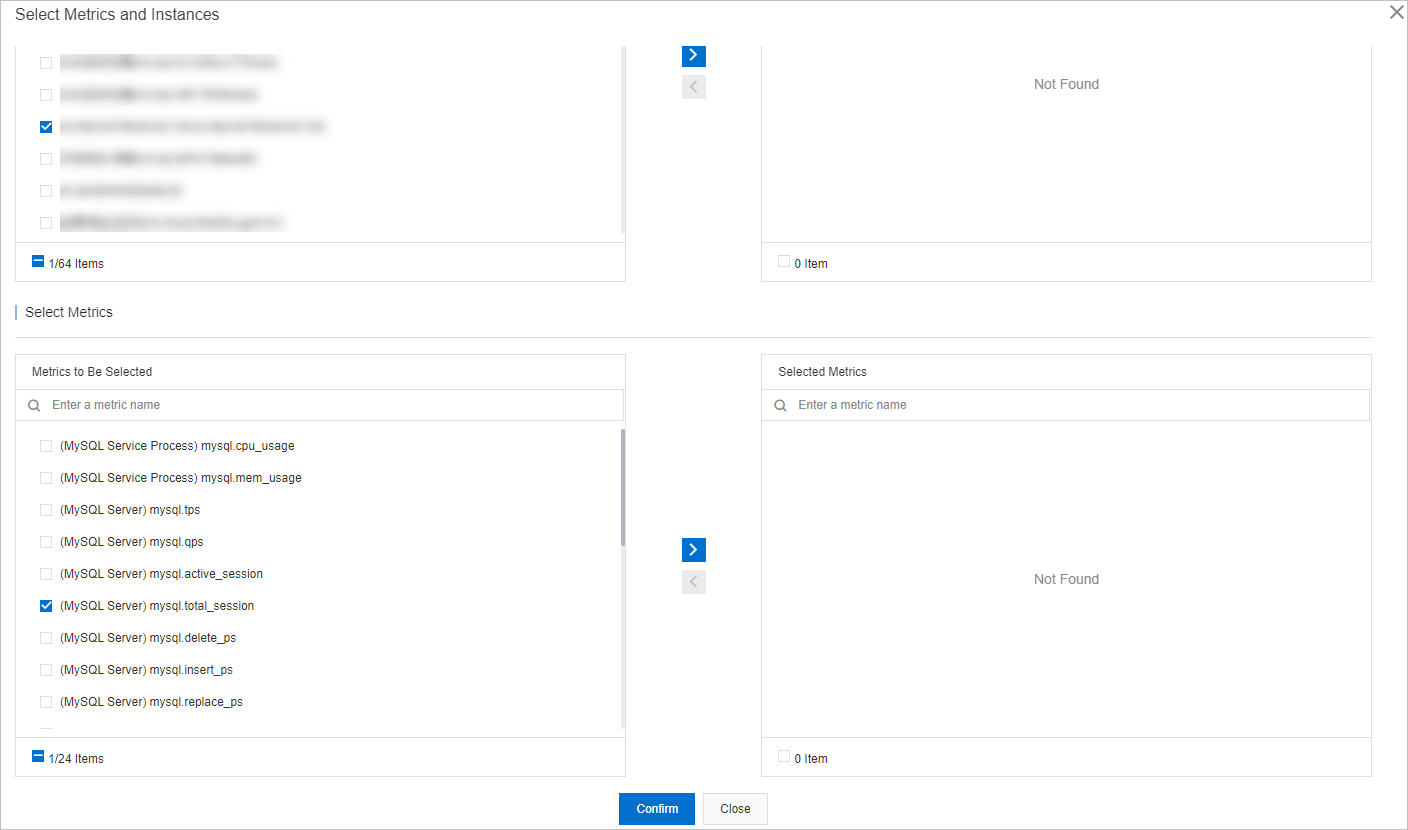
Click Confirm.
NoteTo modify the database instances or metrics in the monitoring dashboard, click Add Instances and Metrics.
View the metric trends of a database instance in the monitoring dashboard
Log on to the DAS console.
In the left-side navigation pane, choose Intelligent O&M Center > Monitoring Dashboard.
On the Custom Dashboard page, click a tab to select a database engine.
On the tab for the specified database engine, select the monitoring dashboard that you want to view and then specify a time range over which you want to view the metric trend charts.
When you select a time range, the end time must be later than the start time, and the interval between the start time and the end time cannot exceed seven days.
NoteIf your database instance is an Tair (Redis OSS-compatible) instance, the interval between the start time and the end time cannot exceed 3 hours.
You can configure Filter by Instance to select multiple instances and compare their metrics.
If you turn on Auto Refresh (Every 5Seconds), DAS refreshes metric trend charts every five seconds.
If you turn on Linkage Chart, the multi-metric linkage feature is enabled. You can view the values of different metrics at the same time point.
You can configure Chart Layout to specify the number of metric trend charts that can be displayed in each row.
You can click Add Instances and Metrics to modify the database instances or metrics in the monitoring dashboard.
You can click Details in the trend chart of a metric to zoom in on the trend chart. In this case, you can change the time range to view the trends of the metric over the specified time range.
You can click Delete in the trend chart of a metric to delete the metric from the dashboard.
Metrics
Metrics of ApsaraDB RDS for MySQL instances and self-managed MySQL databases
Metrics of Tair (Redis OSS-compatible) instances and self-managed Redis databases
Metrics of ApsaraDB for MongoDB instances and self-managed MongoDB databases
Table 1. Metrics of ApsaraDB RDS for MySQL instances and self-managed MySQL databases
Category | Metric | Description |
MySQL Server | tps | The transactions per second (TPS) of the MySQL database. |
qps | The queries per second (QPS) of the MySQL database. | |
active_session | The number of active sessions. | |
total_session | The total number of sessions. | |
delete_ps | The average number of DELETE statements that are executed per second. | |
insert_ps | The average number of INSERT statements that are executed per second. | |
replace_ps | The average number of REPLACE statements that are executed per second. | |
update_ps | The average number of UPDATE statements that are executed per second. | |
select_ps | The average number of SELECT statements that are executed per second. | |
bytes_received | The average number of bytes that are received from all clients per second | |
bytes_sent | The average number of bytes that are sent to all clients per second | |
iops_usage | The IOPS usage. | |
InnoDB storage engine | innodb_bp_hit | The read cache hit ratio of the InnoDB buffer pool. |
innodb_bp_dirty_pct | The ratio of dirty pages in the InnoDB buffer pool. | |
innodb_bp_usage_pct | The utilization of the InnoDB buffer pool. | |
innodb_data_written | The average number of bytes that are written to the InnoDB table per second. | |
innodb_data_read | The average number of bytes that are read from the InnoDB table per second. | |
innodb_rows_deleted | The average number of rows that are deleted from the InnoDB table per second. | |
innodb_rows_read | The average number of rows that are read from the InnoDB table per second. | |
innodb_rows_inserted | The average number of rows that are inserted into the InnoDB table per second. | |
innodb_rows_updated | The average number of rows that are updated in the InnoDB table per second. | |
MySQL process | cpu_usage | The CPU utilization of the MySQL process. The maximum value of this metric is 100% for Alibaba Cloud database instances. |
mem_usage | The memory usage of the MySQL database within the operating system. | |
iops | The IOPS of the MySQL database. | |
disk_usage | The disk usage. |
Table 2. Metrics of Tair (Redis OSS-compatible) instances and self-managed Redis databases
Category | Metric | Description |
Database | instantaneous_ops_per_sec | The number of commands that are processed per second. |
get_qps | The number of read requests per second. | |
put_qps | The number of write requests per second. | |
connection_usage | The connection usage. | |
inflow | The data read from the database over the network per second. | |
outflow | The data written to the database over the network per second. | |
used_memory | The total number of bytes that Redis uses its allocator to allocate. | |
mem_usage | The memory usage. | |
Redis | avg_rt | The average response time of Redis. |
max_rt | The maximum response time of Redis. | |
proxy.avg_rt | The average response time of the Redis proxy node. | |
proxy.max_rt | The maximum response time of the Redis proxy node. | |
proxy.connection_usage | The connection usage of the Redis proxy. | |
cpu_usage | The CPU utilization of the Redis process. | |
Keys | evicted_keys | The number of keys that are evicted due to the maximum memory limit. |
total_keys | The total number of keys in the database. | |
expired_keys | The total number of key expiration events. | |
Redis Keys | hit | The number of hit keys. |
miss | The number of missed keys. |
Table 3. Metrics of ApsaraDB for MongoDB instances and self-managed MongoDB databases
Category | Metric | Description |
MongoDB | opcounters.insert | The number of INSERT statements that are executed per second in MongoDB. |
opcounters.query | The number of QUERY statements that are executed per second in MongoDB. | |
opcounters.update | The number of UPDATE statements that are executed per second in MongoDB. | |
opcounters.delete | The number of DELETE statements that are executed per second in MongoDB. | |
opcounters.command | The number of COMMAND statements that are executed per second in MongoDB. | |
opcounters.getmore | The number of GETMORE statements that are executed per second in MongoDB. | |
connections.current | The number of active sessions in MongoDB. | |
metrics.cursor.open.total | The number of open cursors in MongoDB. | |
metrics.cursor.timedOut | The number of timeout cursors in MongoDB. | |
network.bytesIn | The number of bytes written to MongoDB per second. | |
network.bytesOut | The number of bytes read from MongoDB per second. | |
network.numRequests | The number of requests sent to MongoDB per second. | |
MongoDB process | cpu_usage | The CPU utilization of the MongoDB process. |
mem_usage | The memory usage of the MongoDB process. | |
disk_usage | The disk usage of the MongoDB process. |
Table 4. Metrics of ApsaraDB RDS for PostgreSQL instances
Category | Metric | Description |
Host | cpu_sys_ratio | The CPU utilization of the PostgreSQL process in the kernel state. |
cpu_user_ratio | The CPU utilization of the PostgreSQL process in the user state. | |
cpu_usage | The CPU utilization of the PostgreSQL process. | |
mem_usage | The memory usage of the PostgreSQL process. | |
data.r_s | The read IOPS of the disk on which the data directory resides. | |
data.iops | The IOPS of the disk on which the data directory resides. | |
data.w_s | The write IOPS of the disk on which the data directory resides. | |
local_fs_size_total | The total amount of disk space of the host. | |
data.fs.used | The amount of used space of the disk on which the data directory resides. | |
data.fs.usage | The space usage of the disk on which the data directory resides. | |
network_out_io | The outbound network traffic of the PostgreSQL process. | |
network_io | The network traffic of the PostgreSQL process. | |
network_in_io | The inbound network traffic of the PostgreSQL process. | |
PostgreSQL basic monitoring | waiting_connection | The number of pending connections. |
idle_in_transaction | The number of idle sessions. | |
active_session | The number of active connections. | |
total_session | The total number of current connections. | |
tup_inserted | The number of records that are inserted per second. | |
tup_deleted | The number of records that are deleted per second. | |
tup_updated | The number of records that are updated per second. | |
tup_returned | The number of records that are returned per second for full table scans. | |
tup_fetched | The number of records that are returned per second for index scans. | |
tps | The TPS in PostgreSQL. | |
xact_rollback | The number of transactions that are rolled back per second. | |
xact_commit | The number of transactions that are committed per second. | |
deadlocks | The number of deadlocks per second. | |
oldest_snapshot | The point in time before which the generated dead tuples can be recycled by the ApsaraDB RDS for PostgreSQL instance. | |
max_sent_delay | The latency of data replication from the secondary ApsaraDB RDS for PostgreSQL instance. | |
max_replay_delay | The latency at which the secondary ApsaraDB RDS for PostgreSQL instance replays transaction commits. | |
long_query_5s | The number of SQL statements whose execution duration is greater than or equal to five seconds. | |
long_query_1s | The number of SQL statements whose execution duration is greater than or equal to one second. | |
long_query_3s | The number of SQL statements whose execution duration is greater than or equal to three seconds. | |
long_idle_in_transaction_3s | The number of transactions that are idle for three seconds or longer. | |
long_idle_in_transaction_5s | The number of transactions that are idle for five seconds or longer. | |
long_idle_in_transaction_1s | The number of transactions that are idle for one second or longer. | |
long_2pc_1s | The number of 2PC transactions that last for one second or longer. | |
long_2pc_5s | The number of 2PC transactions that last for five seconds or longer. | |
long_2pc_3s | The number of 2PC transactions that last for three seconds or longer. |
Table 5. Metrics of ApsaraDB RDS for SQL Server instances
Category | Metric | Description |
SQL Server process | cpu_usage | The CPU utilization of the ApsaraDB RDS for SQL Server instance within the operating system. |
db_io | The number of I/O requests per second. | |
db_io_read | The number of read I/O requests per second. | |
db_io_write | The number of write I/O requests per second. | |
other_size | The amount of disk space occupied by system files. | |
log_size | The amount of disk space occupied by log files. | |
tmp_size | The amount of disk space occupied by temporary files. | |
ins_size | The total amount of disk space occupied by the ApsaraDB RDS for SQL Server instance. | |
data_size | The amount of disk space occupied by data files. | |
Database | qps | The average number of SQL statements that are executed per second. |
connection_reset | The total number of logon attempts from the connection pool per second. | |
active_temp_tables | The number of active temporary tables. | |
active_session | The number of active threads. | |
active_cursors | The number of active cursors. | |
sessions | The total number of connections. | |
active_transactions | The number of active transactions. | |
transactions | The average number of transactions per second. | |
write_transactions | The average number of write transactions per second. | |
read_kb | The average volume of outbound traffic from the ApsaraDB RDS for SQL Server instance per second. | |
write_kb | The average volume of inbound traffic to the ApsaraDB RDS for SQL Server instance per second. | |
Basic monitoring | cache_hit_ratio | The hit ratio of the high-speed cache. |
bufferpool | The percentage of pages that are found in the high-speed cache to all pages that are read from disks. | |
fullscans | The average number of full table scans per second. | |
autoparam_attempts_per_sec | The number of auto parameterization attempts per second. | |
forced_parameterizations_per_sec | The number of successful forced parameterizations per second. | |
sql_compilations | The number of SQL compilations per second. | |
unsafe_autoparams_per_sec | The number of unsafe auto parameterization attempts per second. | |
failed_autoparams_per_sec | The number of auto parameterization failures per second. | |
safe_autoparams_per_sec | The number of safe auto parameterization attempts per second. | |
resqlcompilations | The number of SQL statement recompilations per second. | |
lazy_writes | The number of times that dirty pages are written to disks per second. | |
checkpoint | The number of dirty pages that the checkpoint operation must write per second. | |
logout | The number of logouts per second. | |
logins | The number of logons per second. | |
locktimeout | The number of lock requests that time out per second, including requests for NOWAIT locks. | |
deadlock | The number of lock requests that result in a deadlock per second. | |
lock_requests_per_sec | The number of new locks and lock conversions per second. | |
lockwaits | The number of lock requests that the client waits for per second. | |
lock_waits | The statistics of processes waiting for locks. | |
latchwaits | The number of latch requests that are not immediately granted per second. | |
lock_wait_time_ms | The average amount of wait time for each lock request that results in a wait. | |
average_latch_wait_time | The average wait time required to request a latch resource. | |
table_lock_escalations_per_sec | The number of times that a lock on a table is escalated to the HoBT level or the table level. | |
average_lock_wait_time | The average wait time of the requested lock resource. | |
total_latch_wait_time | The total wait time for locks in the last second. |
Table 6. Metrics of PolarDB for MySQL clusters
Category | Metric | Description |
Database | com_delete | The average number of DELETE statements that are executed per second. |
com_insert | The average number of INSERT statements that are executed per second. | |
com_replace | The average number of REPLACE statements that are executed per second. | |
com_select | The average number of SELECT statements that are executed per second. | |
com_update | The average number of UPDATE statements that are executed per second. | |
qps | The QPS of the PolarDB for MySQL cluster. | |
tps | The TPS of the PolarDB for MySQL cluster. | |
PolarDB process | cpu_usage | The CPU utilization of the PolarDB process. The value 200% indicates that two CPU cores are used. |
mem_usage | The memory usage of the PolarDB for MySQL cluster within the operating system. | |
PolarDB Server | active_session | The number of active sessions. |
total_session | The total number of sessions. | |
output_traffic | The average number of bytes that are sent to all clients per second | |
input_traffic | The average number of bytes that are received from all clients per second | |
InnoDB storage engine | innodb_data_read | The average number of bytes that are read from the InnoDB table per second. |
innodb_data_written | The average number of bytes that are written to the InnoDB table per second. | |
innodb_buffer_dirty_ratio | The ratio of dirty pages in the InnoDB buffer pool. | |
innodb_buffer_read_hit | The read cache hit ratio of the InnoDB buffer pool. | |
innodb_buffer_use_ratio | The utilization of the InnoDB buffer pool. | |
innodb_rows_deleted | The average number of rows that are deleted from the InnoDB table per second. | |
innodb_rows_inserted | The average number of rows that are inserted into the InnoDB table per second. | |
innodb_rows_read | The average number of rows that are read from the InnoDB table per second. | |
innodb_rows_updated | The average number of rows that are updated in the InnoDB table per second. |
You can click the  icon on the right of a metric in a dashboard to view the description of the metric.