In the autonomy center of Database Autonomy Service (DAS), you can query the events that occurred within the specified time range. The events are categorized into abnormal events, optimization events, auto scaling events, and other events.
Prerequisites
The database instance that you want to manage is of one of the following types:
ApsaraDB RDS for MySQL
ApsaraDB MyBase for MySQL
ApsaraDB RDS for PostgreSQL
ApsaraDB RDS for SQL Server
PolarDB for MySQL
Tair (Redis OSS-Compatible)
For information about how to connect a database instance to DAS, see Connect an Alibaba Cloud database instance to DAS.
Features
DAS monitors the core metrics of a database instance to detect exceptions. If an exception is detected, DAS checks sessions, SQL statements, and the capacity of the database instance to identify the cause. Then, DAS provides suggestions on how to optimize performance or mitigate losses. You can also authorize DAS to automatically optimize performance or mitigate losses.
The features include:
Procedure
Log on to the DAS console.
In the left-side navigation pane, click Instance Monitoring.
On the page that appears, find the database instance that you want to manage and click the instance ID. The instance details page appears.
On the instance details page, click Autonomy Center in the left-side navigation pane.
On the Autonomy Center tab, click Autonomy Service Settings in the upper-right corner.
On the Autonomous Function Settings tab of the Autonomous Function Management panel, enable the autonomy service and click OK.
On the Autonomy Center tab, specify a time range and view the events that occurred within the specified time range.
The trend chart displays the duration of the events and the variations in the major metrics of the database instance during the events.
Find the event that you want to view and click Details.
FAQ
Q: Why are specific features not displayed on the Autonomous Function Settings tab of the Autonomous Function Management panel?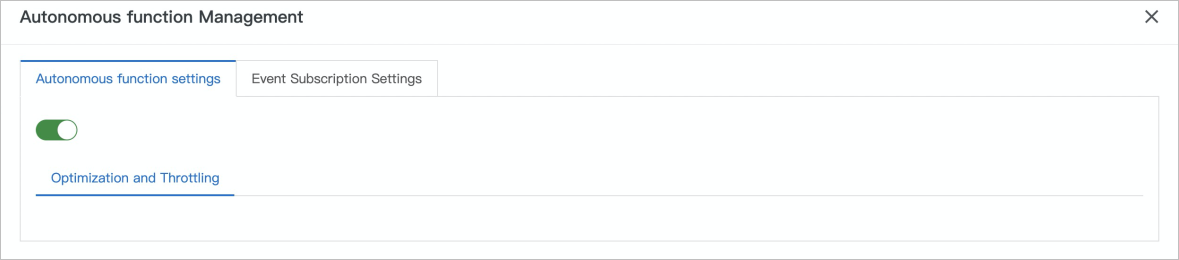
A: The database instance does not support the features of the DAS autonomy center.