You can execute various types of SQL statements on the SQL Console page of the Data Management (DMS) console. On this page, you can add, delete, modify, and query data in the specified database instance in a visualized manner. The SQL Console page is designed for scenarios such as data query and data development.
Prerequisites
You are granted the query permissions on the database or table that you want to query. For more information about how to apply for the permissions, see Manage permissions.
GUI of the SQL Console page
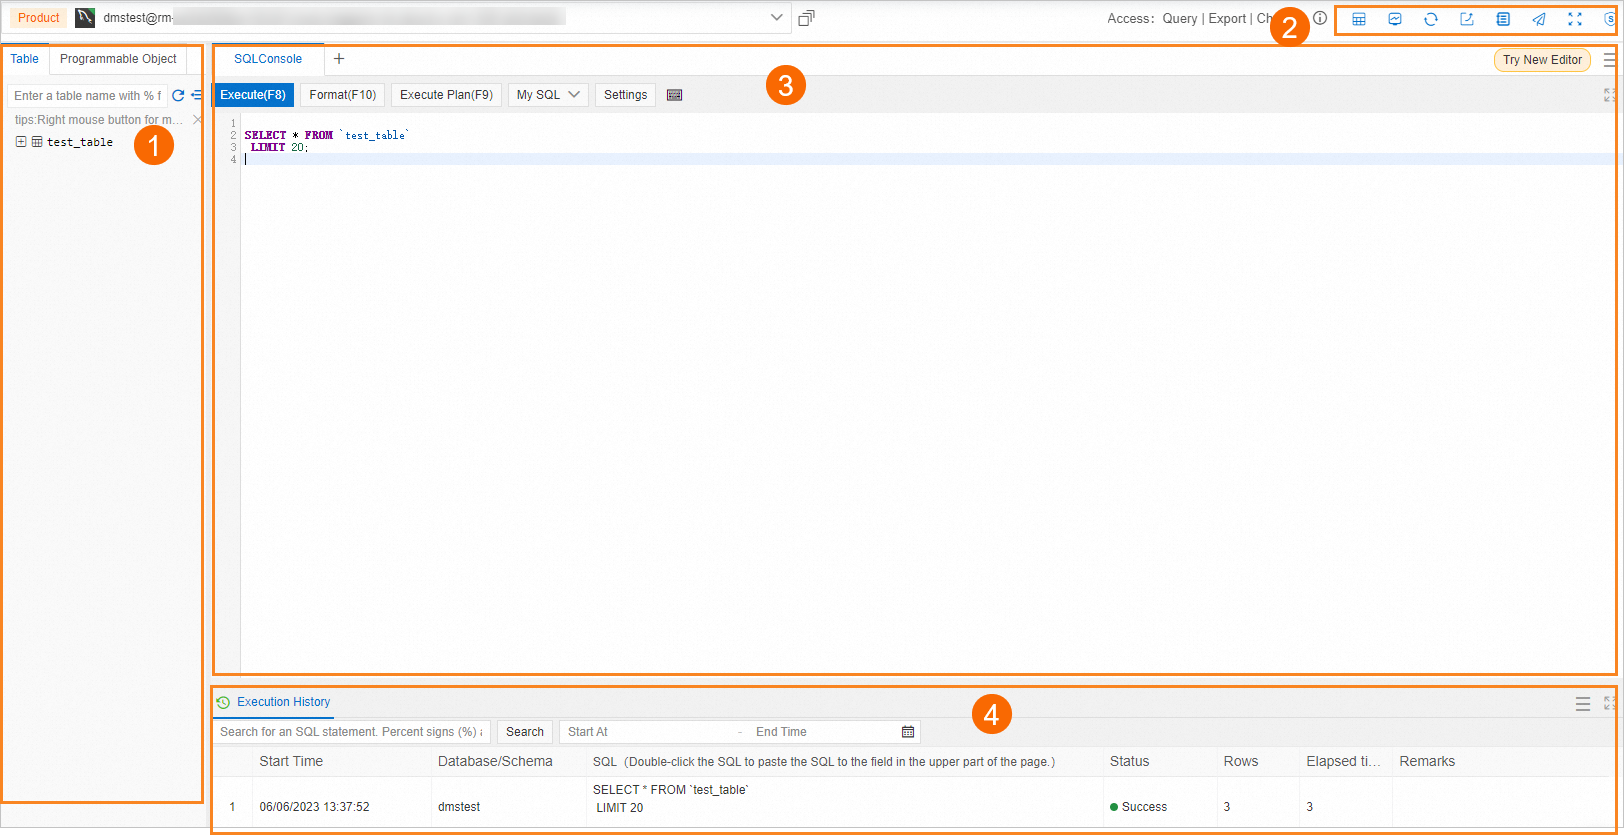
Table 1. GUI of the SQL Console page
No. | Section | Description |
① | Visual operation section | In this section, you can manage your database instance in a visualized manner.
|
② | Extended feature section | This section provides the following icons:
|
③ | Statement execution section | In this section, you can write and execute SQL statements to manage the current database instance. You can also format SQL statements, create execution plans, and configure display settings.
Note You can click the |
④ | Execution result section | In this section, you can view the execution results of SQL statements. You can also view the details of a single row and add, delete, or modify data. Note You can click the Execution History tab to view the historical execution records. For example, you can view the point in time at which the SQL statement is executed, the affected database instance, and the details of the SQL statement. You can also export the execution results based on your business requirements. |
 : You can select options from the shortcut menu of this icon to apply for data ownership and change the permissions that are required to perform DDL, DML, or SELECT operations on the current database instance.
  : the Table List icon. You can click the icon to view tables in the current database instance on the Table List page. Then, you can click the
  icon to return to the SQLConsole tab.
  : the Data Analysis icon. You can click the icon to create a data analysis ticket. For more information, see
  : the Database Autonomy Service (DAS) icon. You can select options from the shortcut menu of this icon to use the features of DAS, including one-click diagnostics, real-time performance, instance session, and spatial analysis. After you select an option, you are navigated to the DAS console. For more information, see
  : the Sync Metadata icon. After you click this icon, DMS collects the latest metadata of the database instance, such as the information about tables, fields, indexes, and programmable objects. This helps you manage permissions on tables, fields, and programmable objects based on different security levels. For more information, see
  : the Export icon. You can select options from the shortcut menu of this icon to export the data of the database instance, table schemas in the database instance, and table creation statements. You can also select the Version management option to view the schema versions of the database instance. For more information, see
  : the Operation audit icon. You can select options from the shortcut menu of this icon to view the information about all data query and data change records. For example, you can query the information about an operation, including the SQL type, the user who performed the operation, and the point in time at which the operation is performed. For more information, see
  : the Share icon. You can click this icon to share the SQLConsole tab and statements of the database instance with relevant stakeholders. For more information, see the
  : the Super SQL Mode icon. You can click this icon to enable the super SQL mode. After you enable this mode as a DMS administrator or a database administrator (DBA), you can execute SQL statements on the SQLConsole tab without being constrained by security rules. For more information, see
  icon in the upper-right corner of the section to open multiple SQLConsole tabs.
 Usage notes
If a table contains sensitive or confidential fields and you do not have permissions on the fields, the values of the fields are displayed as
******in the query results. For more information, see Manage sensitive data.When you query a database, take note of the following items:
For a database that is managed in Flexible Management or Stable Change mode, up to 3,000 rows of data can be returned for a query by default.
For a database that is managed in Security Collaboration mode, 200 rows of data are returned for a query by default, and up to 3,000 rows of data can be returned for a query. If you are a DMS administrator, you can change the maximum number of rows that can be returned for each query based on your business requirements. To do so, perform the following steps: In the top navigation bar of the DMS console, choose Security and Specifications > Security Rules. On the Security Rules page, find the security rule that you want to manage and click Edit in the Actions column. On the SQL Console tab of the Details page, select Basic Configuration Item as the checkpoint, find the configuration item named Maximum number of returned rows per query, and then click Edit in the Actions column.
NoteIf you want to query more rows of data without being constrained by security rules, you can export the data to your computer for query and analysis. If a table contains sensitive fields, you can apply for the export permissions on the sensitive fields before you export the table. For more information about how to apply for permissions and export data, see Manage permissions and Export SQL result sets.
By default, a full scan can be performed on a table that does not exceed 10 GB in size. If you are a DMS administrator, you can change this value based on your business requirements. To go to the page on which you can change this value, perform the following steps: In the top navigation bar of the DMS console, choose .
By default, the timeout period for executing a single SQL statement is 60 seconds. If you are a DMS administrator, you can change this value based on your business requirements. To change this value, perform the following steps: In the top navigation bar, choose Data Assets > . On the Instance List tab, find the database instance that you want to manage, move the pointer over More in the Actions column, and then select Edit. In the Edit dialog box, modify the Query Timeout(s) parameter in the Advanced Information section.
Procedure
- Log on to the DMS console V5.0.
In the top navigation bar, choose .
NoteIf the console is in Simple mode, click the
 icon in the upper-left corner of the console and choose All functions > SQL Console > SQL Console.
 In the Select Database dialog box, enter a keyword to search for a database instance, select the database instance from the search results, and then click Confirm.
On the SQLConsole tab, enter the SQL statements to be executed and click Execute.
What to do next
After you understand the GUI of the SQL Console page, you may need to create tables, query tables, or modify table data on the SQL Console page. For more information, see Manage a database on the SQLConsole tab.