Storage running low without warning can cause instance downtime or data write failures. Database Autonomy Service (DAS) storage analysis gives you a real-time view of how storage is used across your database instances — showing current usage broken down by data, log, and temporary space; a rolling trend over the past week; and an estimated number of days before storage runs out. DAS also automatically flags storage anomalies — tablespace fragments, duplicate indexes, and auto-increment primary key overflow risks — so you can act before they become problems.
Prerequisites
Before you begin, ensure that you have:
A database instance connected to DAS
An instance of one of the following types:
ApsaraDB RDS for MySQL, PolarDB for MySQL, ApsaraDB MyBase for MySQL, or self-managed MySQL
ApsaraDB for MongoDB or self-managed MongoDB
ApsaraDB RDS for PostgreSQL or PolarDB for PostgreSQL
PolarDB for PostgreSQL (Compatible with Oracle)
PolarDB-X 2.0
View global storage usage
If you manage multiple database instances of the same type in DAS, the Global Storage Usage page shows their storage usage side by side, making it easy to identify which instance is consuming the most space.
Global Storage Usage supports the following instance types: ApsaraDB RDS for MySQL, self-managed MySQL, ApsaraDB for MongoDB, and self-managed MongoDB.
Log on to the DAS console.
In the left-side navigation pane, click Storage Analysis.
The Global Storage Usage page appears, showing storage usage for all connected instances of the same type.
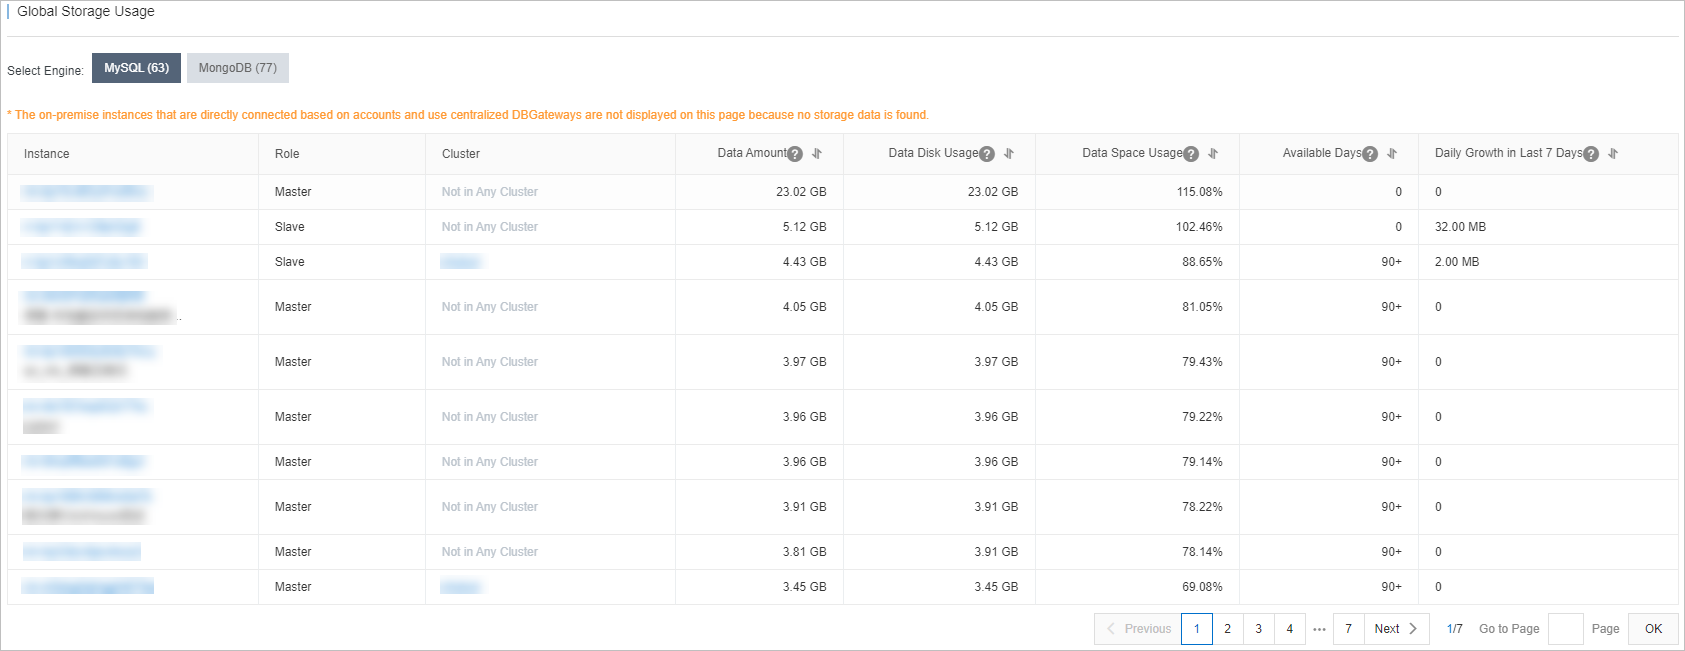
Self-managed database instances connected via Direct Access or Centralized DBGateway are not shown on this page. DAS cannot collect storage data from instances connected using these methods. For information about connection methods for self-managed databases, see Access instances.
View storage analysis for a single instance
Log on to the DAS console.
In the left-side navigation pane, click Instance Monitoring.
Find the instance and click its instance ID to open the instance details page.
In the left-side navigation pane, click Storage Analysis.
The Storage Overview and Data Space tabs show the storage details for the instance.
Storage Overview tab
The Storage Overview tab is organized into four sections:
Storage
Shows the key storage metrics at a glance:
| Metric | Description |
|---|---|
| Exception | Storage anomalies detected by DAS |
| Avg Daily Increase in Last Week | Average daily storage growth over the past seven days |
| Available Days of Storage | Estimated days until storage runs out |
| Used Storage | Total storage currently in use |
Exceptions
Lists anomalies DAS has automatically detected in the instance's tables or collections. If the automatic space optimization feature is enabled, this section also shows the optimization history.
DAS detects three types of storage exceptions:
| Exception type | Affected instances |
|---|---|
| Potential auto-increment primary key overflow | ApsaraDB RDS for MySQL and PolarDB for MySQL |
| Duplicate indexes | ApsaraDB RDS for MySQL and PolarDB for MySQL |
| Tablespace fragments | For more information, see Automatic tablespace fragment recycling |
Storage Trend
Shows a one-week trend chart covering data space, used storage, log space, and temporary space. Use this to spot unusual growth patterns before they exhaust available storage.
Tablespaces
Lists each table in the instance with its storage usage details. Click a table name to view its fields and indexes.
Data Space tab
Breaks down storage usage by database, then by table within each database. Click a table name to view its fields and indexes.
What's next
To automatically reclaim space from tablespace fragments, see Automatic tablespace fragment recycling.
To connect a self-managed database to DAS, see Access instances.