Container Service for Kubernetes (ACK) provides a Resource Profiling feature for native Kubernetes Workloads. By analyzing historical resource usage data, this feature recommends container-level resource specifications, simplifying the complex task of configuring container resource Requests and Limits. This document describes how to use the Resource Profiling feature in an ACK cluster through the console and from the command line.
Prerequisites
The ack-koordinator component is installed. For instructions, see ack-koordinator.
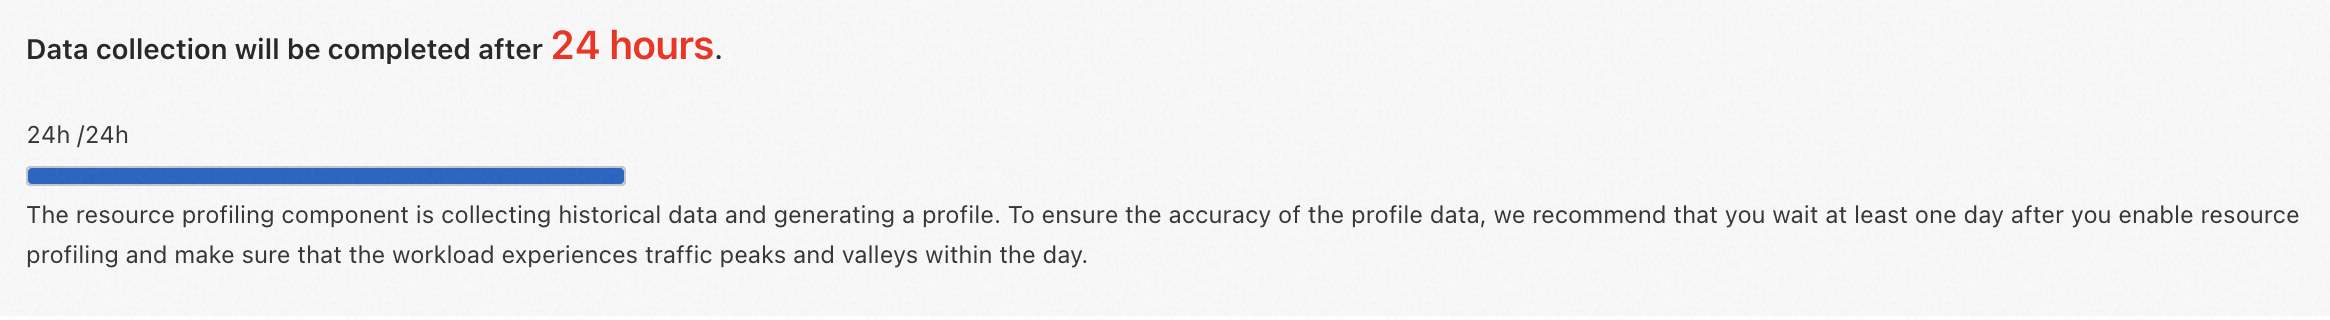
For accurate profiling results, wait at least 24 hours after enabling Resource Profiling for a Workload to allow the system to collect sufficient data.
Billing
The ack-koordinator component is free to install and use. However, additional costs may arise in the following scenarios:
After installation, ack-koordinator requests two general-purpose ACK Pod instances. You can configure the resource requests for each module during component installation.
Ack-koordinator exposes metrics like Resource Profiling in Prometheus format by default. If you select Enable Prometheus Metrics For Ack-koordinator with Alibaba Cloud Prometheus, these are treated as billable custom metrics based on cluster scale. Review the billing documentation for pricing and free quotas before enabling. You can monitor usage via Usage Query.
Limitations
Component | Version requirement |
≥ v0.3.9.7 | |
≥ v1.5.0-ack1.14 |
Introduction to Resource Profiling
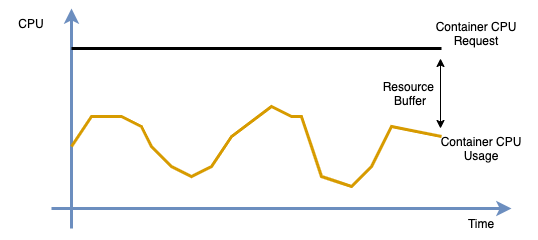
Kubernetes uses resource Requests to manage container resources and schedule Pods based on node availability. Administrators typically set Requests based on experience and historical data, but this manual approach has limitations.
To ensure stability, administrators often reserve excessive buffers for workload fluctuations, leading to low cluster utilization and waste.
Conversely, reducing Requests to increase density can compromise stability during traffic spikes.
To address these challenges, ack-koordinator provides Resource Profiling. It delivers container-level resource recommendations to simplify configuration. ACK offers both command-line and CRD-based management for application resource profiles.
Use Resource Profiling in the console
Step 1: Enable Resource Profiling
Log on to the ACS console. In the left navigation pane, click Clusters.
On the Clusters page, click the name of the target cluster. In the left navigation pane, choose .
On the Cost Optimization page, click the Resource Profiling tab. In the Resource Profiling area, follow the on-screen prompts to enable the feature.
Install or upgrade component: Follow the prompts to install or upgrade the ack-koordinator component.
Profiling Configuration: When using the feature for the first time, after installing or upgrading the component, select Default Settings to control the scope of Resource Profiling (recommended). Adjust the configuration later by clicking Profiling Configuration in the console.
Click Enable Resource Profiling to open the Cost Optimization page.
Step 2: Configure Resource Profiling
On the Cost Optimization page, click the Resource Profiling tab, then click Profiling Configuration.
There are two modes for profiling configuration: Global Configuration and Custom Configuration. The recommended default is Global Configuration. You can change the mode and its parameters here. Click OK to apply the changes.
Global configuration
Global configuration mode enables Resource Profiling for all Workloads, excluding the
arms-promandkube-systemsystem Namespaces by default.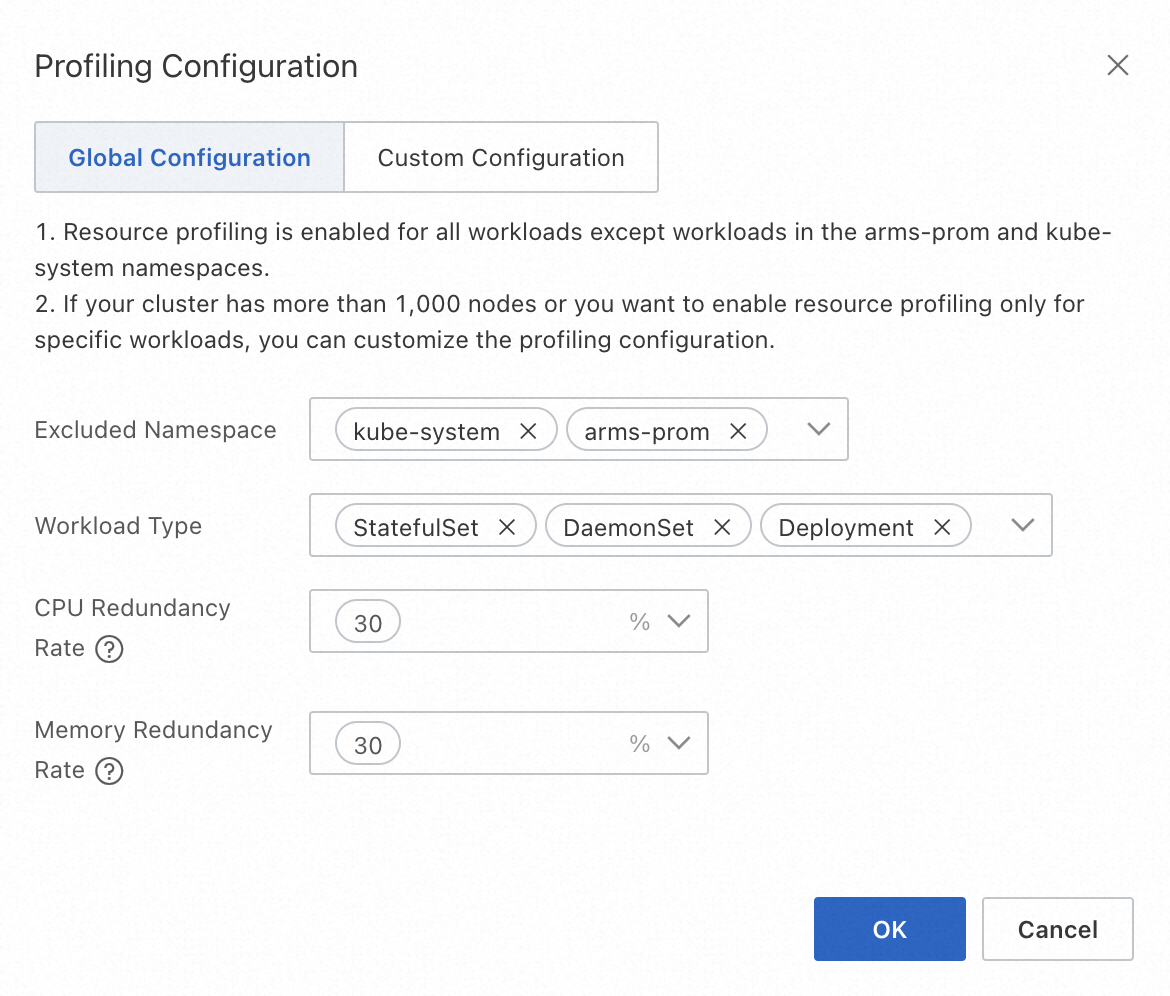
Configuration item
Description
Value range
Excluded Namespace
Namespaces where Resource Profiling will not be enabled, typically for system components. The final enabled scope is the intersection of the enabled Namespaces and Workload types.
Existing Namespaces in the current cluster. You can select multiple Namespaces. The default values are
kube-systemandarms-prom.Workload Type
The scope of Workload types for which Resource Profiling is enabled. The final enabled scope is the intersection of the enabled Namespaces and Workload types.
Supports native Kubernetes Workloads, including Deployment, StatefulSet, and DaemonSet. You can select multiple types.
CPU/Memory Redundancy Rate
The safety margin used to generate resource recommendations. See the description below for details.
Must be a non-negative number. You can select from three common redundancy levels: 70%, 50%, and 30%.
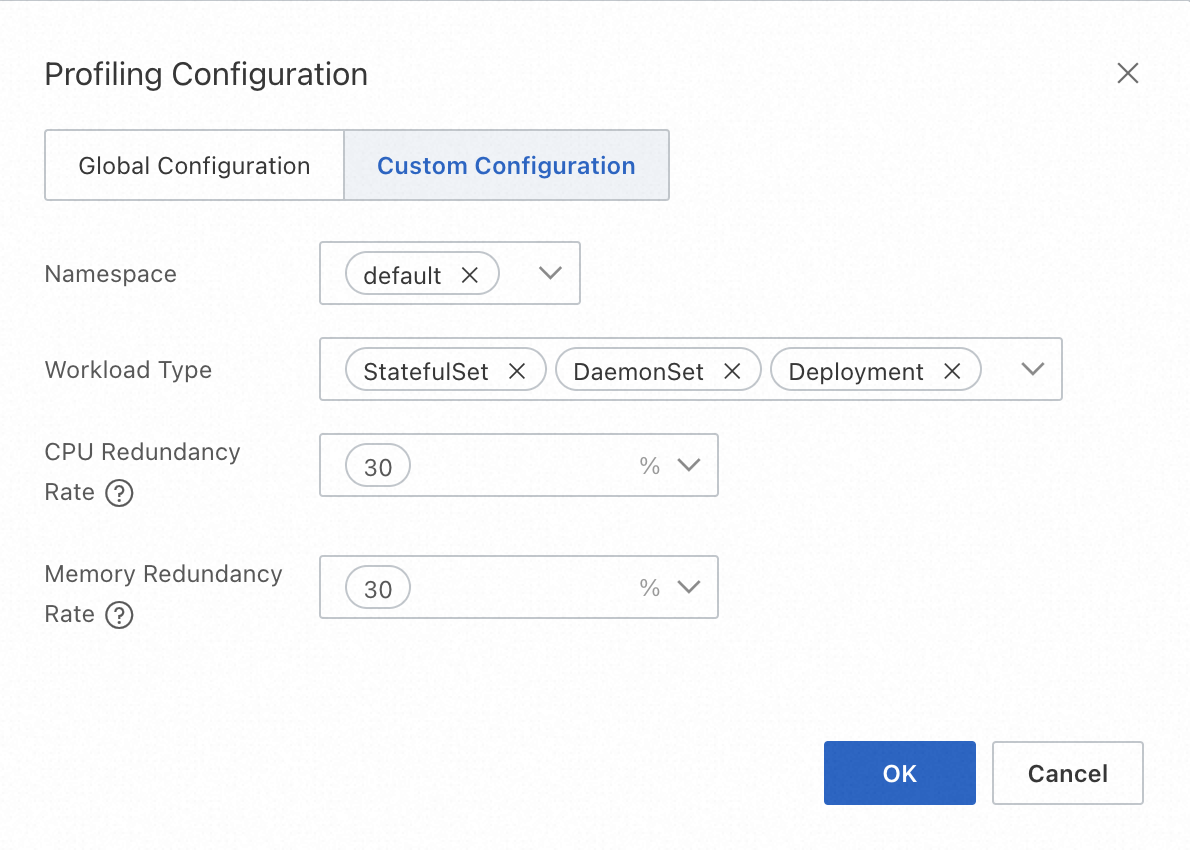
Custom configuration
Custom configuration mode enables Resource Profiling for Workloads in specific Namespaces. If you have a large-scale cluster (for example, over 1,000 nodes) or only want to enable the feature for a subset of Workloads, use this mode to specify them as needed.
Configuration item
Description
Value range
Namespace
Namespaces where Resource Profiling is enabled. The final enabled scope is the intersection of the enabled Namespaces and Workload types.
Existing Namespaces in the current cluster. You can select multiple Namespaces.
Workload Type
The scope of Workload types for which Resource Profiling is enabled. The final enabled scope is the intersection of the enabled Namespaces and Workload types.
Supports three native Kubernetes Workload types: Deployment, StatefulSet, and DaemonSet. You can select multiple types.
CPU/Memory Redundancy Rate
The safety margin used to generate resource recommendations. See the description below for details.
Must be a non-negative number. You can select from three common redundancy levels: 70%, 50%, and 30%.
NoteResource Consumption Redundancy: Administrators typically avoid using 100% of physical resources due to hardware limits like hyper-threading and the need to reserve buffers for peak loads. The console recommends a Downgrade when the difference between the profiled value and the original Request exceeds the safety margin. For the algorithm, see the recommendation logic in the Application profile overview.
Step 3: View the application profile overview
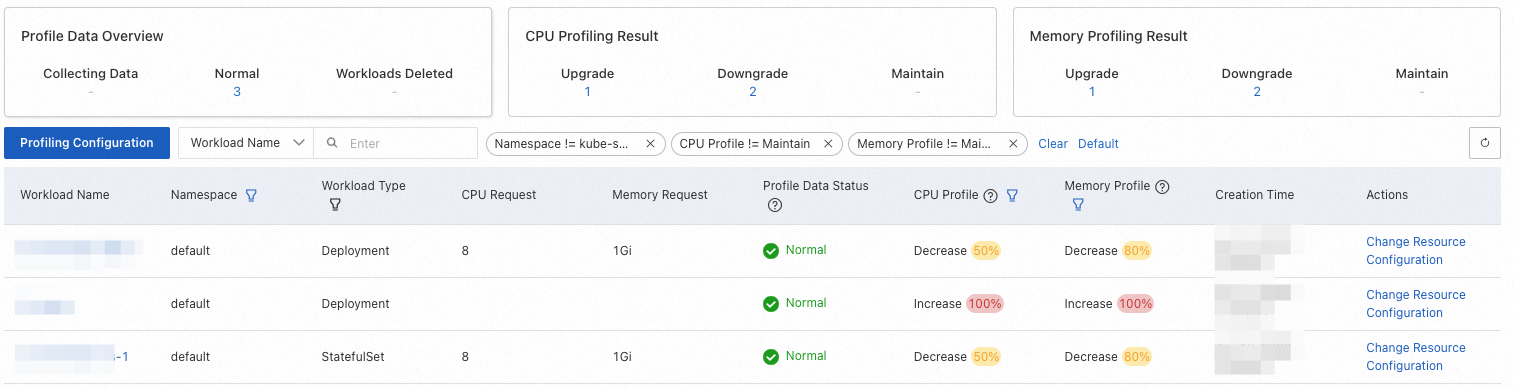
After configuring the Resource Profiling policy, you can view the resource profile for each Workload on the Resource Profiling page.
To improve the accuracy of the results, the system will prompt you that it needs to accumulate at least 24 hours of data when you first use the feature.
The following table describes the columns in the profile overview.
 Note
NoteIn the table below, a hyphen (-) indicates that the item is not applicable.
Column name
Description
Value description
Field filtering support
Workload Name
The name of the Workload.
-
Supported. You can perform an exact search by name at the top of the menu bar.
Namespace
The Namespace of the Workload.
-
Supported. The default filter criteria do not include the
kube-systemNamespace.Workload Type
The type of the Workload.
Includes Deployment, DaemonSet, and StatefulSet.
Supported. The default filter condition is "All".
CPU Request
The CPU resource Request of the Workload's Pod.
-
Not supported.
Memory Request
the memory resource Request of the Workload's Pod.
-
Not supported.
Profile Data Status
The resource profile status of the Workload.
Collecting: The resource profile has just been created and has accumulated little data. For first-time use, we recommend waiting at least 24 hours to ensure the Workload has run stably and has covered traffic peaks and troughs.
Normal: The resource profile has been generated.
Workload Deleted: The corresponding Workload has been deleted. The profile will be automatically removed after a retention period.
Not supported.
CPU Profile, Memory Profile
The recommendation for adjusting the resource Request based on the profiled value, the original Request, and the configured resource consumption redundancy.
Includes Upgrade, Downgrade, and Maintain. The percentage indicates the deviation magnitude. Formula: Abs(Profiled Value - Original Request) / Original Request.
Supported. The default filter criteria include Upgrade and Downgrade.
Creation Time
The creation time of the profile.
-
Not supported.
Actions
After evaluating the profile and recommendations, click Change Resource Configurations to change resources. For more information, see Step 5: Change application resource specifications.
-
Not supported.
NoteACK Resource Profiling generates a profiled value for each container. By comparing this Recommend value, the original Request, and the redundancy Buffer, the console suggests actions like Upgrade or Downgrade. For multi-container Workloads, the recommendation reflects the container with the largest deviation. The calculation logic is as follows.
Profiled Value (Recommend) > Original Resource Request (Request): This indicates the container has been over-utilizing resources (usage is greater than the request) for an extended period, posing a stability risk. The console will suggest Upgrade.
Profiled Value (Recommend) < Original Resource Request (Request): This indicates potential resource waste, meaning the specification can be reduced. This is determined by the configured resource consumption redundancy. The details are as follows:
Calculate the target resource specification (Target) based on the profiled value and the configured redundancy:
Target = Recommend * (1 + Buffer)Calculate the deviation degree (Degree) between the Target and the original Request:
Degree = 1 - Request / TargetGenerate a recommendation for CPU and memory based on the profiled value and the Degree. If the absolute value of the Degree is greater than 0.1, the console prompts a Downgrade suggestion.
In all other cases, the recommendation is Maintain, which means no immediate adjustment is needed.
Step 4: View application profile details
On the Resource Profiling page, click a Workload name to open its Profile Details page.
The details page has three sections: basic Workload information, resource curves for each container's profile details, and a window for changing the application's resource specifications.Taking CPU as an example, the meanings of the metrics in the profile details resource curve are as follows.
Curve Name
Description
cpu limit
The container's CPU resource limit.
cpu request
The container's CPU resource request.
cpu recommend
The container's CPU profiled value.
cpu usage (average)
The average CPU usage of all container replicas within the Workload.
cpu usage (max)
The maximum CPU usage among all container replicas within the Workload.
Step 5: Change application resource specifications
In the Resource Upgrade/Downgrade area at the bottom of the application's Profile Details page, modify the resource specifications for each container based on the profiled values.
The meanings of each column are as follows:
Configuration Item
Description
Current Required Resources
The container's current resource Request.
Current Limited Resources
The container's current resource Limit.
Profiled Value
The profiled value generated by Resource Profiling for the container, which can be used as a reference for the resource Request.
Safety Redundancy
The safety margin configured in the resource profiling policy. It can be used as a reference for the target required resources. For example, add the redundancy factor to the profiled value (for example,
4.28 * 1.3 = 5.6in the image).Target Required Resources
The target value to which the container's resource Request will be adjusted.
Target Limited Resources
The target value to which the container's resource Limit will be adjusted. Note: If the Workload uses CPU topology-aware scheduling, the CPU resource limit must be configured as an integer.
ImportantThe profiled value generated by Resource Profiling is the actual recommended value calculated by the algorithm. If you click the Apply button to perform a Resource Upgrade/Downgrade, ACK will normalize the application's resource specifications for different compute types. For details, see Resource specifications.
To perform a rolling update on the Workload, click Apply and then OK. This will update the resource specifications and automatically redirect you to the Workload details page.
ImportantUpdating resource specifications triggers a rolling update, which recreates the Pods. Proceed with caution.
Use Resource Profiling from the command line
Step 1: Enable Resource Profiling
Create a
recommendation-profile.yamlfile with the following YAML content to enable Resource Profiling for a Workload.Creating a
RecommendationProfileCRD enables Resource Profiling for matching Workloads and lets you obtain recommendation data. TheRecommendationProfileCRD supports controlling the enabled scope through Namespace and Workload type. The final enabled scope is the intersection of the two.apiVersion: autoscaling.alibabacloud.com/v1alpha1 kind: RecommendationProfile metadata: # The name of the object. Do not specify a namespace for a non-namespaced type. name: profile-demo spec: # The workload types for which to enable resource profiling. controllerKind: - Deployment # The namespaces for which to enable resource profiling. enabledNamespaces: - defaultThe meanings of each configuration field are as follows:
Parameter
Type
Description
metadata.nameString
The name of the object. If the RecommendationProfile is a non-namespaced type, you do not need to specify a Namespace.
spec.controllerKindString
The Workload types for which Resource Profiling is enabled. Supported types include Deployment, StatefulSet, and DaemonSet.
spec.enabledNamespacesString
The scope of Namespaces for which Resource Profiling is enabled.
Run the following command to enable Resource Profiling for the target application.
kubectl apply -f recommender-profile.yamlCreate a
cpu-load-gen.yamlfile with the following YAML content.apiVersion: apps/v1 kind: Deployment metadata: name: cpu-load-gen labels: app: cpu-load-gen spec: replicas: 2 selector: matchLabels: app: cpu-load-gen-selector template: metadata: labels: app: cpu-load-gen-selector spec: containers: - name: cpu-load-gen image: registry.cn-zhangjiakou.aliyuncs.com/acs/slo-test-cpu-load-gen:v0.1 command: ["cpu_load_gen.sh"] imagePullPolicy: Always resources: requests: cpu: 8 # The CPU request for this application is 8 cores. memory: "1Gi" limits: cpu: 12 memory: "2Gi"Run the following command to deploy the cpu-load-gen application.
kubectl apply -f cpu-load-gen.yamlRun the following command to get the resource specification profile.
kubectl get recommendations -l \ "alpha.alibabacloud.com/recommendation-workload-apiVersion=apps-v1, \ alpha.alibabacloud.com/recommendation-workload-kind=Deployment, \ alpha.alibabacloud.com/recommendation-workload-name=cpu-load-gen" -o yamlNoteFor accurate profiling results, wait at least 24 hours to allow the system to collect sufficient data.
ack-koordinator generates a corresponding resource specification profile for each Workload with Resource Profiling enabled and saves the result in a Recommendation CRD. An example of the resource specification profile for the Workload named
cpu-load-genis shown below.apiVersion: autoscaling.alibabacloud.com/v1alpha1 kind: Recommendation metadata: labels: alpha.alibabacloud.com/recommendation-workload-apiVersion: app-v1 alpha.alibabacloud.com/recommendation-workload-kind: Deployment alpha.alibabacloud.com/recommendation-workload-name: cpu-load-gen name: f20ac0b3-dc7f-4f47-b3d9-bd91f906**** namespace: recommender-demo spec: workloadRef: apiVersion: apps/v1 kind: Deployment name: cpu-load-gen status: recommendResources: containerRecommendations: - containerName: cpu-load-gen target: cpu: 4742m memory: 262144k originalTarget: # This indicates an intermediate result of the resource profiling algorithm. Do not use it directly. # ...For easier retrieval, the Recommendation and the Workload share the same Namespace. The Workload's API version, type, and name are stored in the labels, as described in the table below.
Label key
Description
Example
alpha.alibabacloud.com/recommendation-workload-apiVersionThe API version of the Workload. Due to Kubernetes label constraints, forward slashes (/) are replaced with hyphens (-).
app-v1 (was app/v1)
alpha.alibabacloud.com/recommendation-workload-kindThe corresponding Workload type, such as Deployment and StatefulSet.
Deployment
alpha.alibabacloud.com/recommendation-workload-nameThe name of the Workload. Due to Kubernetes label constraints, the length cannot exceed 63 characters.
cpu-load-gen
The resource specification profile for each container is stored in
status.recommendResources.containerRecommendations. The meanings of each field are as follows.Field name
Description
Format
Example
containerNameThe name of the container.
string
cpu-load-gen
targetThe resource specification profile, including CPU and Memory dimensions.
map[ResourceName]resource.Quantity
cpu: 4742mmemory: 262144k
originalTargetRepresents intermediate results of the resource profiling algorithm. Do not use this field directly.
-
-
NoteThe minimum recommended value for a single container is 25m for CPU and 250Mi for memory.
By comparing the declared resource specifications in the target application
cpu-load-genwith the profiling results from this step, you can see that the container's CPU Request is too high. You can reduce the Request to save cluster resources.Category
Original resource specification
Resource resource specification
CPU
8 cores
4.742 cores
Step 2: (Optional) View results in Prometheus
The ack-koordinator component provides a Prometheus query interface for the resource profiling results. If you are using a self-managed Prometheus monitoring system, refer to the following monitoring items to configure your dashboard.
# The CPU resource specification profile for a container in a workload.
koord_manager_recommender_recommendation_workload_target{exported_namespace="$namespace", workload_name="$workload", container_name="$container", resource="cpu"}
# The memory resource specification profile for a container in a workload.
koord_manager_recommender_recommendation_workload_target{exported_namespace="$namespace", workload_name="$workload", container_name="$container", resource="memory"}
FAQ
How does the Resource Profiling algorithm work?
The algorithm analyzes historical resource usage to generate recommendations. It works as follows:
Data Collection: It continuously collects container resource usage data, calculating aggregate statistics like peak usage, weighted averages, and percentiles for CPU and memory.
Recommendation Logic: The CPU recommendation is set to the P95 (95th percentile) of usage, and the memory recommendation is set to the P99 (99th percentile). A safety margin is added to both to ensure workload reliability.
Time Weighting: It uses a half-life sliding window model based on data from the last 14 days, giving higher weight to more recent data samples to adapt to changing usage patterns.
Runtime Events: It incorporates runtime status information, such as Out of Memory (OOM) events, to improve the accuracy of memory recommendations.
What are the ideal application types for Resource Profiling?
Best suited for:
Online services with fluctuating but somewhat predictable traffic patterns. The algorithm is designed to ensure resource availability to cover peak usage.
Less suitable for:
Offline/batch jobs: The recommendations may be too conservative for these workloads, which prioritize throughput over immediate resource availability and can tolerate some resource contention.
Active-standby applications: For critical components deployed in an active-standby model, the idle standby replicas can skew usage data, leading to recommendations that are too low.
For less suitable application types, you should treat the recommendations as a baseline and adjust them based on your specific operational requirements.
Can I directly use profiled values to set my container's requests and limits?
It is not recommended to apply the profiled values directly without review. The values represent a summary of past resource demand and should be used as a strong baseline, not a final configuration.
You should always adjust the recommendations based on your application's specific needs, for example:
Peak traffic buffers: Reserving extra capacity to handle anticipated traffic spikes or promotional events.
High availability: Allocating additional resources to support seamless failover in an active-active disaster recovery setup.
Performance sensitivity: For applications sensitive to host-level resource contention, you might need to set
requestshigher than the recommendation to ensure stable performance.
Why does Resource Profiling suggest a new Upgrade or Downgrade right after I applied a previous recommendation?
This occurs because ACK normalizes resource specifications based on the underlying instance's compute type when you apply a change. The final, normalized value may differ from the raw recommended value.
The process is as follows:
Resource Profiling generates a raw recommendation (for example,
4.742cores).You accept and apply this recommendation through the console.
ACK normalizes the value to fit the constraints of the node's compute type (for example, rounding it to
4.5cores). For details, see Resource specifications.The new, normalized request (
4.5cores) now differs from the original recommendation (4.742cores), which may trigger a newDowngradesuggestion.
How do I scrape Resource Profiling metrics with a self-managed Prometheus?
The ack-koordinator component exposes metrics via an HTTP endpoint on its koord-manager pods. To scrape these metrics with your own Prometheus server, follow these steps:
1. Find the koord-manager Pod IP
The koord-manager deployment runs in an active-standby mode, and only the active pod serves metrics. First, find the pod IPs.
# Get the Pod IP addresses
kubectl get pod -n kube-system -o wide | grep ack-koord-manager

# Example output:
# ack-koord-manager-5479f85d5f-7xd5k   1/1   Running   0   19d   192.168.12.242   ...
# ack-koord-manager-5479f85d5f-ftblj   1/1   Running   0   19d   192.168.12.244   ...
2. Verify the Metrics Endpoint
Use curl to check the /metrics endpoint on one of the IPs. The default port is 9326. If one IP fails, try the other, because only the leader serves metrics.
# Replace with your Pod IP
curl -s http://192.168.12.244:9326/all-metrics | grep koord_manager_recommender_recommendation_workload_target

# Expected output will include metrics like:
# koord_manager_recommender_recommendation_workload_target{...resource="cpu",...} 2.406
# koord_manager_recommender_recommendation_workload_target{...resource="memory",...} 3.861631195e+09
3. Configure Prometheus Scrape Job
The ack-koordinator installation automatically creates Service and ServiceMonitor objects, which you can use for service discovery in Prometheus. Configure your Prometheus instance to scrape the koord-manager service. Refer to the official Prometheus documentation for your specific scrape configuration.
How do I reset Resource Profiling by deleting all its data and rules?
This command removes all Recommendation CRs, which store the generated resource suggestions.
kubectl delete recommendation -A --allThis command removes all RecommendationProfile CRs, which define which workloads to profile.
kubectl delete recommendationprofile -A --allHow do I grant a RAM user the necessary permissions to use Resource Profiling?
To authorize a RAM user, you must grant permissions at two levels: Alibaba Cloud RAM (for console access) and Kubernetes RBAC (for in-cluster actions).
1. Grant RAM permissions
In the RAM console grant the
AliyunACKReadOnlyAccesssystem policy to the target RAM user. This provides the necessary read permissions for ACK-related cloud resources. For details, see Grant permissions by using a system policy.2. Grant Kubernetes RBAC permissions
In the ACK console, assign the RAM user the pre-defined
developerRBAC role (or a higher role likeadmin) for the target cluster. This grants broad read/write access to Kubernetes resources needed for profiling. For instructions, see Configure RBAC permissions for a RAM user or RAM role.
Alternative: Fine-grained RBAC permissions
If you want to grant more granular control instead of the broad developer role, create a custom ClusterRole with permissions specifically for the Resource Profiling CRDs.
Apply the following
ClusterRolemanifest to your cluster:
apiVersion: rbac.authorization.k8s.io/v1
kind: ClusterRole
metadata:
  name: recommendation-clusterrole
rules:
- apiGroups:
  - "autoscaling.alibabacloud.com"
  resources:
  - "*"
  verbs:
  - "*"
You must then bind this
ClusterRoleto the RAM user using aClusterRoleBinding.