The API server generates audit logs to record Kubernetes API requests and responses. Container Service for Kubernetes (ACK) allows cluster administrators to analyze the audit logs of the API server to audit operations performed on resources by different users. This enables cluster administrators to trace the history of cluster operations and troubleshoot cluster exceptions, which greatly simplifies cluster security O&M.
Usage notes
This topic applies to ACK managed clusters, ACK dedicated clusters, and ACK Serverless clusters.
For more information about how to use the cluster auditing feature in registered clusters, see Use cluster auditing.
Billing
On the bills overview page, you can view the billing information about audit log data. For more information, see View your bills. For more information about the billing method of audit logs, see Pay-by-feature.
Step 1: Enable cluster auditing
By default, Enable Log Service is automatically selected when you create a cluster to enable the cluster auditing feature. If the cluster auditing feature is disabled, perform the following steps to enable it.
Log on to the ACK console. In the left-side navigation pane, click Clusters.
On the Clusters page, find the cluster that you want to manage and click its name. In the left-side pane, choose .
If you have not enabled the cluster log or cluster auditing feature, follow the on-screen instructions to manually select a Simple Log Service project and enable the feature.
Make sure that the following Simple Log Service quotas within your Alibaba Cloud account are sufficient. Otherwise, you fail to enable the cluster auditing feature.
The quota on Simple Log Service projects.
The quota on Logstores in each Simple Log Service project.
The quota on dashboards in each Simple Log Service project.
For more information about Simple Log Service quotas and how to adjust quotas, see Adjust resource quotas.
Step 2: View audit log reports
Do not modify audit log reports. If you want to customize audit log reports, log on to the Simple Log Service console and create new reports.
ACK provides four built-in audit log reports, which provide an overview of the audit center, an overview of resource operations, a detailed list of resource operations, and a list of Common Vulnerabilities and Exposures (CVE) vulnerabilities. On the Cluster Auditing page, you can filter audit events by namespace or RAM user and view the following content in reports.
You can also click the ![]() icon in the upper-right part of a chart to perform other operations, such as viewing the chart in full-screen mode or previewing query statements.
icon in the upper-right part of a chart to perform other operations, such as viewing the chart in full-screen mode or previewing query statements.
Overview
This report displays all events in the current ACK cluster and detailed information about important events, such as RAM user operations, Internet access, command executions, resource deletion, Secret access, and Kubernetes CVE vulnerabilities.
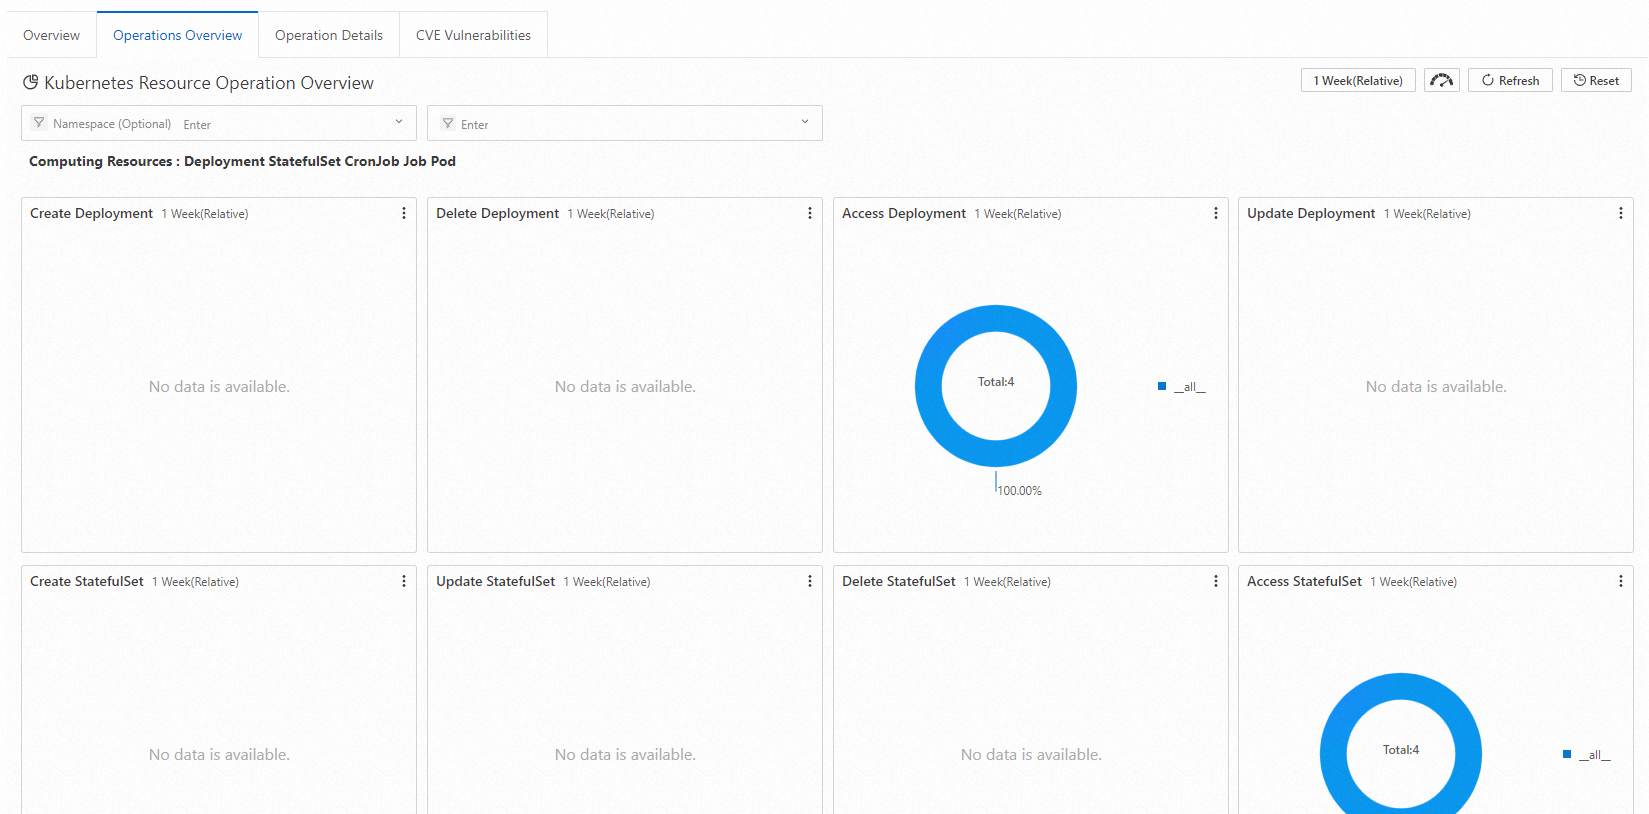
Operations Overview
This report provides statistics about common operations related to computing resources, network resources, and storage resources in the cluster. The operations include creating, updating, deleting, and accessing resources.
Computing resources: Deployment, StatefulSet, CronJob, DaemonSet, Job, and Pod.
Network resources: Service and Ingress.
Storage resources: ConfigMap, Secret, and PersistentVolumeClaim.
Access control resources: Role, ClusterRole, RoleBinding, and ClusterRoleBinding.
Operation Details
This report provides operation details on a resource type. You can select or enter a resource type to query operation details in real time. The report displays the total number of operations, distribution of namespaces, operation success rate, trend of operations over time, and other operation details.
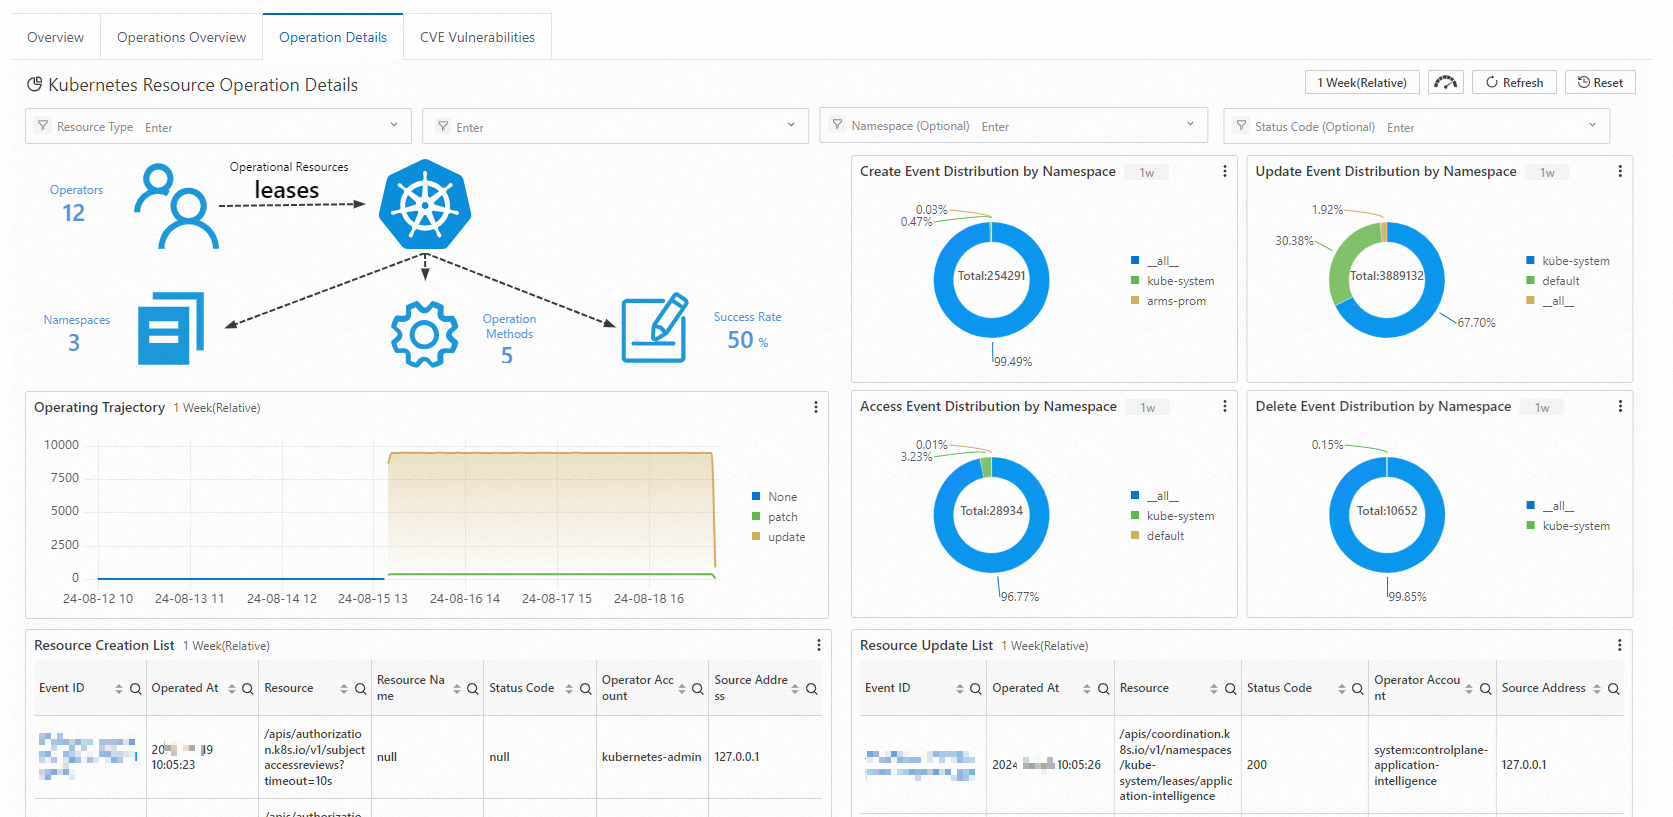
To query operations related to CustomResourceDefinition (CRD) resources registered in Kubernetes or resources that are not listed in the report, enter the plural form of the resource name. For example, to query operations related to the AliyunLogConfig CRD, enter AliyunLogConfigs.
CVE Vulnerabilities
This report displays Kubernetes CVE vulnerabilities in the current cluster. You can select or enter a RAM user ID to query information in real time. Then, the report displays Kubernetes CVE vulnerabilities related to the RAM user that you specify. For more information about CVE vulnerabilities and solutions, see [CVE Securities] CVE vulnerability fixes.
(Optional) Step 3: View detailed log data
To customize queries or analyze audit log data, log on to the Simple Log Service console and view detailed log data.
By default, the retention period of the audit logs of the API server in an ACK managed cluster is 30 days and the retention period of the audit logs of the API server in an ACK dedicated cluster is 365 days. For more information about how to modify the default retention period, see Manage a logstore.
Log on to the ACK console. In the left-side navigation pane, click Clusters.
On the Clusters page, find the cluster that you want to manage and click its name. In the left-side pane, click Cluster Information.
On the Basic Information tab, click the project ID next to Log Service Project. In the Logstores list, click the Logstore named audit-${clustered}.
During the cluster creation process, a Logstore named
audit-${clustereid}is automatically created in the project.ImportantBy default, indexes are configured for the Logstore. Do not modify the indexes in case reports cannot be generated.
Enter a query statement and specify the time range to be queried, such as 15 minutes. Then, click Search & Analysis to view the query results.
You can query audit logs in the following ways:
To query the operations performed by a RAM user, enter the RAM user ID and click Search & Analysis.
To query the operations performed on a resource, enter the name of the computing, network, storage, or access control resource and click Search & Analysis.
To filter out operations related to system components, enter
NOT user.username: node NOT user.username: serviceaccount NOT user.username: apiserver NOT user.username: kube-scheduler NOT user.username: kube-controller-managerand click Search & Analysis.
For more information about how to query log data, see Query methods.
(Optional) Step 4: Configure alerting
You can configure Simple Log Service to generate alerts in real time when operations are performed on specific resources. Supported alert notification methods include
DingTalk chatbots, custom webhooks, and Alibaba Cloud Message Center. For more information, see Configure an alert rule in Simple Log Service.
Example 1: Generate alerts when commands are executed in containers
An enterprise wants to forbid users to log on to containers or run commands in containers. When a user runs a command in a container, an alert is immediately generated. The alert message contains information about the container, command, user, event ID, time, and source IP address.
Sample query statement:
verb : create and objectRef.subresource:exec and stage:  ResponseStarted | SELECT auditID as "Event ID", date_format(from_unixtime(__time__), '%Y-%m-%d %T' ) as "Time",  regexp_extract("requestURI", '([^\?]*)/exec\?.*', 1)as "Resource",  regexp_extract("requestURI", '\?(.*)', 1)as "Command" ,"responseStatus.code" as "Status code",
 CASE
 WHEN "user.username" != 'kubernetes-admin' then "user.username"
 WHEN "user.username" = 'kubernetes-admin' and regexp_like("annotations.authorization.k8s.io/reason", 'RoleBinding') then regexp_extract("annotations.authorization.k8s.io/reason", ' to User "(\w+)"', 1)
 ELSE 'kubernetes-admin' END
 as "User account",
CASE WHEN json_array_length(sourceIPs) = 1 then json_format(json_array_get(sourceIPs, 0)) ELSE  sourceIPs END
as "Source IP address" order by "Time" desc  limit 10000
The condition expression is
Event =~ ".*".
Example 2: Generate alerts when the API server fails to access the Internet
A cluster has Internet access enabled. To prevent attacks, the enterprise needs to monitor the number of times and failure rate of Internet access. When the number of times of Internet access reaches the threshold (10) and the failure rate exceeds the threshold (50%), an alert is immediately generated. The alert message contains information about the region of the source IP address, source IP address, and whether the IP address is risky.
Sample query statement:
* | select ip as "Source IP address", total as "Number of times of Internet access", round(rate * 100, 2) as "Failure rate in percentage", failCount as "Number of times of illegal access", CASE when security_check_ip(ip) = 1 then 'yes' else 'no' end  as "Whether the IP address is risky",  ip_to_country(ip) as "Country", ip_to_province(ip) as "Province", ip_to_city(ip) as "City", ip_to_provider(ip) as "ISP" from (select CASE WHEN json_array_length(sourceIPs) = 1 then json_format(json_array_get(sourceIPs, 0)) ELSE  sourceIPs END
as ip, count(1) as total,
sum(CASE WHEN "responseStatus.code" < 400 then 0
ELSE 1 END) * 1.0 / count(1) as rate,
count_if("responseStatus.code" = 403) as failCount
from log  group by ip limit 10000) where ip_to_domain(ip) != 'intranet' and ip not LIKE '%,%' ORDER by "Number of times of Internet access" desc limit 10000
The condition expression is
Source IP address =~ ".*".
What to do next
Change the Simple Log Service project
If you want to migrate audit logs to another Simple Log Service project, you can use the Change Log Service Project feature in cluster auditing.
Log on to the ACK console. In the left-side navigation pane, click Clusters.
On the Clusters page, find the cluster that you want to manage and click its name. In the left-side pane, choose .
In the upper-right corner of the cluster auditing page, click Change Log Service Project to migrate audit logs to another Simple Log Service project.
Disable cluster auditing
You can perform the following steps to disable cluster auditing.
Log on to the ACK console. In the left-side navigation pane, click Clusters.
On the Clusters page, find the cluster that you want to manage and click its name. In the left-side pane, choose .
In the upper-right corner of the Cluster Auditing page, click Disable Cluster Auditing.
Use a third-party log service in an ACK dedicated cluster
We recommend that you use Simple Log Service to store audit logs. To use a third-party log service, you can choose not to use Simple Log Service when you create the cluster and then integrate the third-party log service to collect and retrieve audit logs. You can obtain the audit log source files of master nodes in the /var/log/kubernetes/kubernetes.audit path. The files are in the JSON format.
Introduction to the cluster auditing configuration for ACK dedicated clusters
When you configure cluster components for an ACK dedicated cluster, the console selects Enable Log Service by default to enable cluster auditing. Event data is collected based on the audit policy and written to the backend.
This feature involves modifications to the kube-apiserver startup parameters and is only applicable to ACK dedicated clusters. The cluster control planes of ACK managed clusters and ACK Serverless clusters are managed by ACK and do not support manual modifications.
Audit policy
The audit policy defines the audit configuration and log collection rules. Event logs of different audit levels are collected based on different log collection rules. The following table describes the audit levels.
Audit level | Log collection rule |
None | Events that match the rule are not collected. |
Metadata | Collect the request metadata, such as the user information and timestamps. The request body and response body are not collected. |
Request | Collect the request metadata and request body. The response body is not collected. This rule does not apply to non-resource requests. |
RequestResponse | Collect the request metadata, request body, and response body. This rule does not apply to non-resource requests. |
You can set the --audit-policy-file flag to save the following YAML file as the boot configuration of the API server. After you log on to a master node, you can view the audit policy file in the /etc/kubernetes/audit-policy.yml directory. The following YAML file is a sample audit policy.
Logs are not immediately generated after requests are received. Logs are generated only after response headers are sent.
The system does not audit kube-proxy watch requests, GET requests sent from the kubelet and system:nodes to nodes, endpoint operations performed by Kubernetes components in the kube-system namespace, and GET requests sent from the API server to namespaces.
The system records the request and response bodies based on reads and writes for the authentication, rbac, certificates, autoscaling, and storage APIs.
The audit backend
The collected audit events are stored in the backend log file system as log files in JSON format. You can configure the following flags as the boot configuration of the API server.
After you log on to a master node, you can view the configuration file of the API server in the /etc/kubernetes/manifests/kube-apiserver.yaml directory.
Flag | Description |
| The maximum number of shards of audit logs that can be stored. Default value: 10. |
| The maximum memory storage for an individual audit log. Default value: 100 MB. |
| The output path of audit logs. Default value: |
| The retention period of audit logs in days. Default value: 7. |
| The path of the audit policy file. Default value: |
References
To use
kubectl execto audit command executions inside containers, see Enable container auditing.For more information about security best practices for enterprise security O&M engineers, see Best security practices.