After you install an Application Monitoring component of Application Real-Time Monitoring Service (ARMS), ack-onepilot, for a Java application that is deployed in Container Service for Kubernetes (ACK), ARMS starts to automatically discover application topology, generate 3D topology, monitor interfaces, and capture abnormal and slow transactions. This significantly enhances the efficiency of online problem diagnosis.
Background
ARMS is an application performance management (APM) service. It provides comprehensive monitoring for Java applications deployed in ACK without the need to modify code. By installing and authorizing ack-onepilot, you can efficiently identify failed requests and slow requests, reproduce request parameters, detect memory leaks, and discover system bottlenecks. For more information about ARMS Application Monitoring, see What is Application Monitoring.
Prerequisites
A namespace is created. For more information, see Manage namespaces and resource quotas. In this example, a namespace named
arms-demois used.The version of the JDK is supported by Application Monitoring. ARMS supports the following JDK versions:
JDK 1.7.0+
ImportantThe ARMS agent V3.0.X and later will no longer support Java 7. If you are still using Java 7, we recommend that you upgrade your Java version. For more information, see Application Monitoring no longer supports Java 7.
JDK 1.8.0_25+
NoteIf you deploy applications in Kubernetes clusters, we recommend that you use JDK V1.8.0_191 or later.
Make sure that the JDK version is not 1.8.0_25 or 1.8.0_31. Otherwise, the ARMS agent may fail to be installed. In this case, we recommend that you upgrade JDK to the latest 1.8.X.
JDK 11.0.8+
JDK 17
ARMS is activated. For more information, see Activate ARMS.
Step 1: Install the ARMS Application Monitoring component
The old component arms-pilot is no longer maintained. You can install the new component ack-onepilot to monitor your application. The ack-onepilot component is fully compatible with arms-pilot. You can seamlessly install ack-onepilot without the need to modify application configurations. For more information, see How do I uninstall arms-pilot and install ack-onepilot?
Log on to the ACK console. In the left navigation pane, click Clusters.
On the Clusters page, find the one you want to manage and click its name. In the left navigation pane, click Add-ons.
In the Logs and Monitoring section, find ack-onepilot and click Install. In the dialog box that appears, configure the parameters as needed. We recommend using the default values. Then, click OK.
NoteBy default, ack-onepilot supports 1,000 pods. For every additional 1,000 pods in the cluster, you must add 0.5 CPU cores and 512 MB of memory for ack-onepilot.
After installing ack-onepilot, you can upgrade, configure, or uninstall it on the Add-ons page.
Step 2: Authorize ARMS to access resources
To monitor an application deployed in an ACK cluster with no
addon.arms.token, perform the following operations to authorize the ACK cluster to access ARMS. If theaddon.arms.tokenalready exists, no further authorization is needed.NoteIn ACK clusters,
addon.arms.tokenenables ARMS to automatically perform password-free authorization. Normally, ACK managed clusters haveaddon.arms.tokenby default. However, some of the ACK managed clusters created earlier may not includeaddon.arms.token.Check whether the cluster has
addon.arms.token.If
addon.arms.tokendoes not exist, perform the following these steps to manually authorize the cluster to access ARMS resources :Log on to the ACK console. In the left navigation pane, click Clusters.
On the Clusters page, find the target cluster and click its name. In the navigation pane on the left, click Cluster Information.
Click the Basic Information tab. In the Cluster Resources section, click the link to the right side of Worker RAM Role.
On the Permissions tab, click Grant Permission.
Select the AliyunARMSFullAccess policy and click Grant permissions.
To monitor an application deployed in an ACK managed cluster that is connected to an elastic container instance, go to the RAM Quick Authorization page and complete the authorization. Then, restart the pods that are created for ack-onepilot.
Step 3: Enable ARMS to monitor a Java application
To enable Application Monitoring when you create a new application, perform the following steps:
Log on to the ACK console. In the left navigation pane, click Clusters.
On the Clusters page, find the cluster you want to manage and click its name. In the left navigation pane, choose .
On the Deployments page, click Create from YAML in the upper part of the page.
On the Create page, select a template from the Sample Template drop-down list and add the following
labelsto the spec.template.metadata field in the Template code editor.labels: armsPilotAutoEnable: "on" armsPilotCreateAppName: "<your-deployment-name>" # Replace <your-deployment-name> with the actual application name. armsSecAutoEnable: "on" # If you want to connect the application to Application Security, you must configure this parameter.NoteFor more information about Application Security, see What is Application Security.
For more information about the billing of Application Security, see Billing.
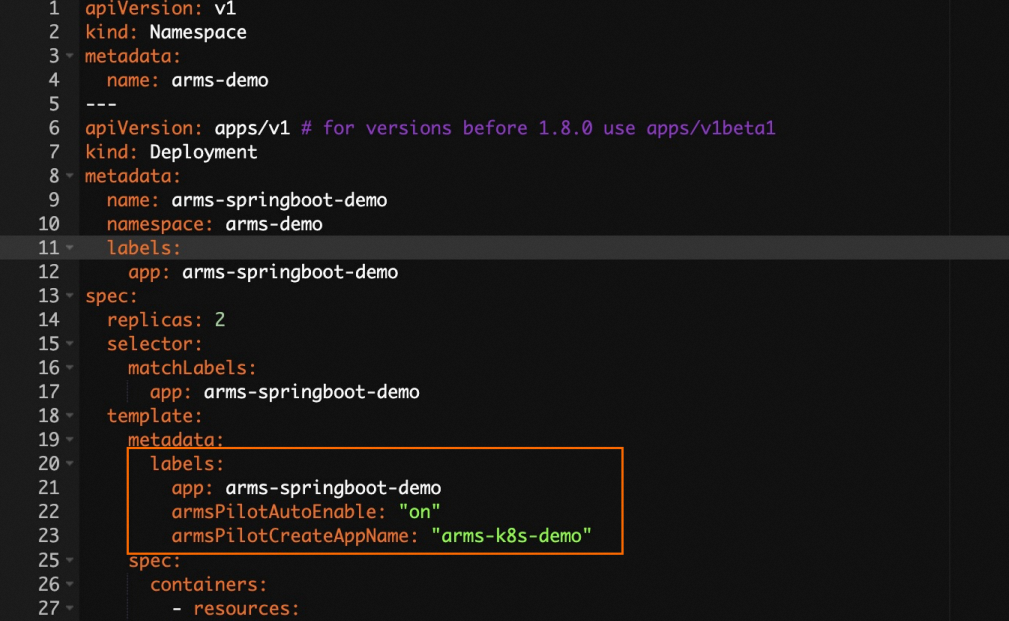
The following YAML template shows how to create a Deployment and enable Application Monitoring for the application:
What to do next
After you complete the preceding steps, ARMS Application Monitoring is enabled for the application deployed in your ACK cluster. On the Deployments page, choose  > ARMS Console in the Actions column of the application to view the application monitoring details. For more information, see Application overview.

FAQ
Why is the monitoring data abnormal after I change the cluster or namespace of an application?
How do I use ack-onepilot when a VPC connection cannot be established?
Why does an ARMS agent fail to be installed for an application in an ACK cluster?
Why are the suffixes of application names missing after I update the applications?