By default, Horizontal Pod Autoscaler (HPA) supports automatic scaling based on CPU and memory metrics. However, these metrics may not be sufficient for complex O&M scenarios. This topic describes how to convert custom and external metrics collected by Prometheus into scaling metrics that HPA can use by obtaining monitoring data and setting up scaling configurations. This provides a more flexible and convenient scaling mechanism for your applications.
Prerequisites
A Prometheus monitoring component is deployed. For more information, see Connect to and configure Prometheus Service.
The ack-alibaba-cloud-metrics-adapter component is deployed. For more information, see Deploy the ack-alibaba-cloud-metrics-adapter component.
NoteLog on to the Container Service for Kubernetes (ACK) console. On the page, deploy the ack-alibaba-cloud-metrics-adapter component.
Features
By default, HPA only supports autoscaling based on CPU and memory, which may not meet daily O&M requirements. Prometheus Service fully integrates with the open source Prometheus ecosystem. It supports monitoring for a wide range of components, provides many out-of-the-box dashboards, and offers a fully managed Prometheus service. This process involves three main steps:
Expose monitoring metrics using Prometheus Service in an ACK cluster.
Convert Prometheus monitoring metrics into Kubernetes aggregation metrics that HPA can use using the ack-alibaba-cloud-metrics-adapter component. For more information, see Autoscaling on multiple metrics and custom metrics.
Configure and deploy HPA to perform elastic scaling based on the metrics from the preceding step.
Metrics are divided into two types based on the scenario:
Custom Metric: Scales based on metrics related to a Kubernetes target object, such as a pod. An example is a metric from the pod's own dimension. For more information, see autoscaling-on-multiple-metrics-and-custom-metrics.
External Metric: Scales based on metrics that are not related to a Kubernetes target object, such as a pod. For example, you can scale the pods of a workload based on the overall business queries per second (QPS) metric. For more information, see autoscaling-on-metrics-not-related-to-kubernetes-objects.
The following sections describe how to configure the ack-alibaba-cloud-metrics-adapter to convert Prometheus Service metrics into HPA-compatible metrics and enable autoscaling based on those metrics.
Step 1: Obtain Prometheus monitoring data
Example 1: Use default container monitoring metrics in ACK
You can use the default metrics from Prometheus Service, which is installed by default in ACK, for HPA elastic scaling. Supported metrics include cAdvisor container monitoring metrics, Node-Exporter infrastructure monitoring metrics, GPU-Exporter metrics, and all other metrics that you have connected to Prometheus Service. To view the metrics connected to Prometheus Service, perform the following steps:
Log on to the ACK console. In the left navigation pane, click Clusters.
On the Clusters page, find the cluster you want and click its name. In the left navigation pane, choose .
In the upper-right corner, click Go to Prometheus Service.
In the navigation pane on the left of the Prometheus Service console, click Settings to view all metrics connected to Prometheus Service.
Example 2: Use Prometheus metrics reported by a pod
Deploy a test application and expose its metrics using the standard Prometheus method. For more information, see metric_type. The following section describes how to deploy the sample-app application and expose the http_requests_total metric to track the number of requests.
Deploy the application workload.
Log on to the ACK console. In the left navigation pane, click Clusters.
On the Clusters page, click the name of the target cluster. In the navigation pane on the left, click .
On the right side of the Stateless page, click Create From YAML. On the Create page that opens, for Sample Template, select Custom, enter the following YAML, and then click Create.
Add a ServiceMonitor
Log on to the ARMS console.
In the navigation pane on the left, click Provisioning. On the Provisioned tab, under the Container Environment tab, select the region where the cluster is located, and then click the name of the corresponding environment. The environment name is the same as the cluster name.
On the container environment page, click the Metric Collection tab. In the navigation pane on the left of the current page, click ServiceMonitor. On the ServiceMonitor page, click Add. In the Add ServiceMonitor Config panel, click YAML Edit, add the following ServiceMonitor configuration, and follow the on-screen instructions to create the ServiceMonitor.
apiVersion: monitoring.coreos.com/v1
kind: ServiceMonitor
metadata:
  annotations:
    arms.prometheus.io/discovery: 'true'
  name: sample-app
  namespace: default
spec:
  endpoints:
  - interval: 30s
    port: http
    path: /metrics
  namespaceSelector:
    any: true
  selector:
    matchLabels:
      app: sample-app
Confirm the monitoring status.
Click the Self-monitoring tab. In the Targets section, if default/sample-app/0(1/1 up) is displayed, Prometheus Service is successfully monitoring the deployed application.
In the Prometheus dashboard, query the value of
http_requests_totalfor a recent time range to confirm that the monitoring data is correctly obtained.
Step 2: Modify the configuration of the ack-alibaba-cloud-metrics-adapter component
Log on to the ACK console. In the left navigation pane, click Clusters.
On the Clusters page, click the name of the target cluster. In the navigation pane on the left, click .
On the Helm page, find ack-alibaba-cloud-metrics-adapter and click Update in the Actions column.
In the Update Release panel, configure the following YAML, and then click OK.
The following table describes some of the fields. For a detailed description of the ack-alibaba-cloud-metrics-adapter configuration file, see Detailed description of the ack-alibaba-cloud-metrics-adapter component configuration file.
Field
Description
AlibabaCloudMetricsAdapter. prometheus.adapter.rules.customModify the content of this field to match the corresponding content in the example YAML.
alibabaCloudMetricsAdapter. prometheus.urlThe address of Prometheus Service. For information about how to obtain the Prometheus data request URL, see How to obtain the Prometheus data request URL.
AlibabaCloudMetricsAdapter. prometheus.prometheusHeader[].AuthorizationThe authentication information. For more information, see How to obtain the Prometheus data request URL.
Prometheus V1: Authentication is not required by default. If token authentication is enabled, you must configure this parameter.
Prometheus V2: Authentication is enabled by default. If passwordless access is not enabled, you must configure this parameter.
AlibabaCloudMetricsAdapter. prometheus.adapter.rules.defaultCreates predefined metrics by default. We recommend that you disable this by setting the value to
false.
After you configure the component parameters and deploy the component, you can run the following commands to check whether the Kubernetes aggregation API has successfully accessed the data.
Scale containers using Custom Metrics
Run a Custom Metrics query to view the details and list of available HPA metrics.
kubectl get --raw "/apis/custom.metrics.k8s.io/v1beta1/" | jq .Query the current values of the
container_memory_working_set_bytes_per_secondandcontainer_cpu_usage_core_per_secondmetrics in the kube-system namespace.# Query container_memory_working_set_bytes_per_second to view the current working memory size per second of pods in the kube-system namespace. kubectl get --raw "/apis/custom.metrics.k8s.io/v1beta1/namespaces/kube-system/pods/*/container_memory_working_set_bytes_per_second" | jq . # Query container_cpu_usage_core_per_second to view the CPU core usage per second of pods in the kube-system namespace. kubectl get --raw "/apis/custom.metrics.k8s.io/v1beta1/namespaces/kube-system/pods/*/container_cpu_usage_core_per_second" | jq .The following code block shows a sample query result:
{
  "kind": "MetricValueList",
  "apiVersion": "custom.metrics.k8s.io/v1beta1",
  "metadata": {
    "selfLink": "/apis/custom.metrics.k8s.io/v1beta1/namespaces/kube-system/pods/%2A/container_cpu_usage_core_per_second"
  },
  "items": [
    {
      "describedObject": {
        "kind": "Pod",
        "namespace": "kube-system",
        "name": "ack-cost-exporter-7f44d55c66-cgtz7",
        "apiVersion": "/v1"
      },
      "metricName": "container_cpu_usage_core_per_second",
      "timestamp": "2025-12-30T03:30:21Z",
      "value": "4m",
      "selector": null
    }
Scale containers using External Metrics
Run an External Metrics query to view the details and list of available external HPA metrics.
kubectl get --raw "/apis/external.metrics.k8s.io/v1beta1/" | jq .Query the current value of the
http_requests_per_secondmetric in the default namespace.kubectl get --raw "/apis/external.metrics.k8s.io/v1beta1/namespaces/default/http_requests_per_second" | jq .Example:
{
  "kind": "ExternalMetricValueList",
  "apiVersion": "external.metrics.k8s.io/v1beta1",
  "metadata": {},
  "items": [
    {
      "metricName": "http_requests_per_second",
      "metricLabels": {},
      "timestamp": "2025-12-30T03:29:40Z",
      "value": "328m"
    }
  ]
}
Step 3: Configure and deploy HPA to scale based on the obtained metrics
The current version supports exposing Custom Metrics and External Metrics from Prometheus Service at the same time. You can choose one of the following methods to scale containers using HPA as needed.
Custom Metrics
Create an hpa.yaml file.
kind: HorizontalPodAutoscaler
apiVersion: autoscaling/v2
metadata:
  name: sample-app-memory-high
spec:
# Description of the HPA's scaling target. HPA will dynamically modify the number of pods for this object.
  scaleTargetRef:
    apiVersion: apps/v1
    kind: Deployment
    name: sample-app
# The minimum and maximum number of pods for the HPA.
  minReplicas: 1
  maxReplicas: 10
# An array of metrics to monitor. Multiple types of metrics can coexist.
  metrics:
  - type: Pods
    pods:
      # Use the metric: pods/container_memory_working_set_bytes_per_second.
      metric:
        name: container_memory_working_set_bytes_per_second
 # The target value is of type AverageValue. Only AverageValue type targets are supported for Pods metrics.
      target:
        type: AverageValue
        averageValue: 1024000m       # Here, 1024000m represents a 1 KB memory threshold. The current metric unit is byte/per second. 'm' is a Kubernetes precision unit. When a decimal point appears and Kubernetes needs high precision, it uses units like 'm' or 'k'. For example, 1001m=1.001, and 1k=1000.
Create the HPA application.
kubectl apply -f hpa.yamlAfter you enable load balancing for the Service, run the following command to perform a stress test.
Replace
<EXTERNAL-IP>with the external IP address or domain name of the Server Load Balancer (SLB) instance for the sample-app Service.ab -c 50 -n 2000 http://<EXTERNAL-IP>:8080/Run the following command to view HPA details.
kubectl get hpa sample-app-memory-highExpected output:
NAME                     REFERENCE               TARGETS         MINPODS   MAXPODS   REPLICAS   AGE
sample-app-memory-high   Deployment/sample-app   40886272/1024   1         10        1          22s
External Metrics
Create an hpa.yaml file.
apiVersion: autoscaling/v2
kind: HorizontalPodAutoscaler
metadata:
  name: sample-app
spec:
  scaleTargetRef:
    apiVersion: apps/v1
    kind: Deployment
    name: sample-app
  minReplicas: 1
  maxReplicas: 10
  metrics:
    - type: External
      external:
        metric:
          name: http_requests_per_second
          selector:
            matchLabels:
              job: "sample-app"
# Only Value and AverageValue type targets are supported for External metrics.
        target:
          type: AverageValue
          averageValue: 500m
Create the HPA application.
kubectl apply -f hpa.yamlAfter you enable load balancing for the Service, run the following command to perform a stress test.
Replace
<EXTERNAL-IP>with the external IP address or domain name of the Server Load Balancer (SLB) instance for the sample-app Service.ab -c 50 -n 2000 http://<EXTERNAL-IP>:8080/Run the following command to view HPA details.
kubectl get hpa sample-appExpected output:
NAME         REFERENCE               TARGETS    MINPODS   MAXPODS   REPLICAS   AGE
sample-app   Deployment/sample-app   33m/500m   1         10        1          7m
Detailed description of the ack-alibaba-cloud-metrics-adapter component configuration file
The ack-alibaba-cloud-metrics-adapter component converts Prometheus metrics into HPA-compatible metrics in the following steps:
Discovery: The ack-alibaba-cloud-metrics-adapter component discovers available metrics from Prometheus.
Association: Associates metrics with Kubernetes resources, such as pods, nodes, and namespaces.
Naming: Defines the names of the converted HPA-compatible metrics for HPA to reference.
Querying: Defines how to query metric data from Prometheus.
The following example shows the complete configuration file for the ack-alibaba-cloud-metrics-adapter component that converts the http_requests_total metric exposed by the sample-app container into the http_requests_per_second metric in HPA.
- seriesQuery: http_requests_total{namespace!="",pod!=""}
  resources:
    overrides:
      namespace: {resource: "namespace"}
      pod: {resource: "pod"}
  name:
    matches: ^(.*)_total
    as: ${1}_per_second
  metricsQuery: sum(rate(<<.Series>>{<<.LabelMatchers>>}[2m])) by (<<.GroupBy>>)
Field | Description |
| Prometheus Query Language (PromQL) request data. |
| Performs an aggregate operation on the PromQL request data in seriesQuery. Note The |
| A data label in PromQL that is matched with a |
| Converts the Prometheus metric name into a more readable metric name using a regular expression. Here, |
Discovery
Specifies the Prometheus metric to be converted. You can use
seriesFiltersto filter metrics.seriesQuerycan be used to search for metrics based on labels. The following code provides an example.seriesQuery: http_requests_total{namespace!="",pod!=""} seriesFilters: - isNot: "^container_.*_seconds_total"seriesFiltersis an optional field that you can use to filter metrics:is:<regex>: Matches metrics that contain the specified regular expression.isNot:<regex>: Matches metrics that do not contain the specified regular expression.
Association
Sets the mapping between Prometheus metric labels and Kubernetes resources. The labels for the
http_requests_totalmetric includenamespace!=""andpod!="".- seriesQuery: http_requests_total{namespace!="",pod!=""} resources: overrides: namespace: {resource: "namespace"} pod: {resource: "pod"}Naming
Converts the Prometheus metric name into an HPA metric name. This does not change the original Prometheus metric name. If you use the original Prometheus metric, you do not need to configure this parameter.
You can run the
kubectl get --raw "/apis/custom.metrics.k8s.io/v1beta1"command to view all available HPA metrics.- seriesQuery: http_requests_total{namespace!="",pod!=""} resources: overrides: namespace: {resource: "namespace"} pod: {resource: "pod"} name: matches: "^(.*)_total" as: "${1}_per_second"Querying
This template is used to query the Prometheus API. The ack-alibaba-cloud-adapter populates this template with parameters from the HPA, sends a request to the Prometheus API, and returns the value to the HPA to enable elastic scaling.
- seriesQuery: http_requests_total{namespace!="",pod!=""} resources: overrides: namespace: {resource: "namespace"} pod: {resource: "pod"} name: matches: ^(.*)_total as: ${1}_per_second metricsQuery: sum(rate(<<.Series>>{<<.LabelMatchers>>}[2m])) by (<<.GroupBy>>)
How to obtain the Prometheus data request URL
Scenario 1: Alibaba Cloud Prometheus monitoring
Log on to the ACK console. In the left navigation pane, click Clusters.
On the Clusters page, find the cluster you want and click its name. In the left navigation pane, choose .
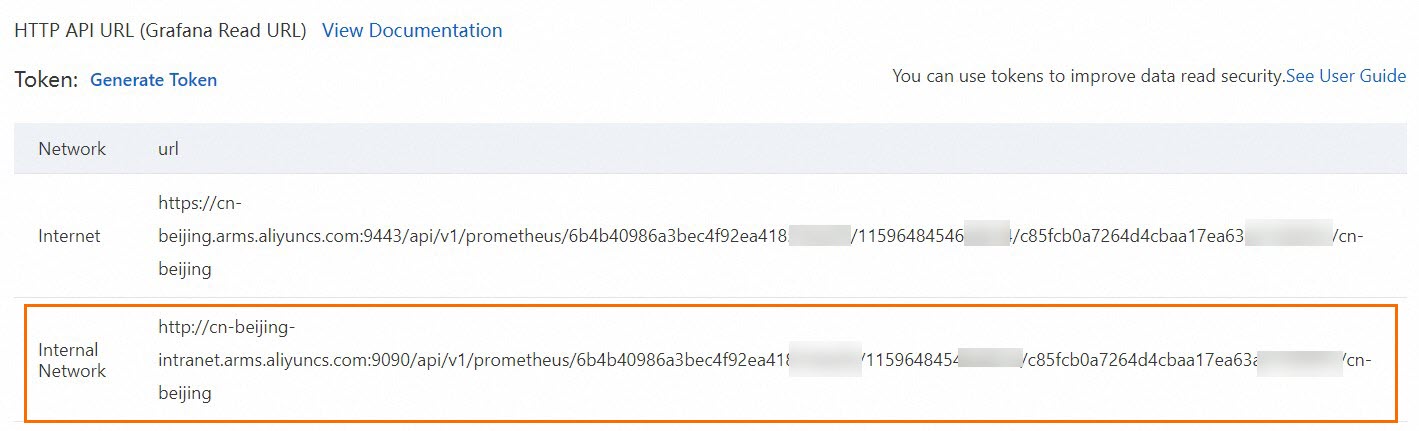
In the upper-right corner, click Go to Prometheus Service. In the navigation pane on the left of the Prometheus Service console, click Settings. Then, click the Settings tab to obtain the HTTP API Address (Grafana Read Address).
We recommend that you use the internal network. If the internal network is not available, you can use the public network.
Create Prometheus authentication information.
Prometheus V1: If token authentication is enabled, you can directly configure the token in the component configuration.

...
    prometheus:
      prometheusHeader:
      - Authorization: {Token}
...
Prometheus V2: Authentication based on an AccessKey pair is enabled by default. If you have not enabled passwordless access in the Prometheus console, you must Base64-encode the AccessKey ID and AccessKey secret and then enter the encoded string into the ack-alibaba-cloud-metrics-adapter component configuration.
Generate a Base64-encoded string.
Concatenate the obtained AccessKey ID and AccessKey secret in the
AccessKey:AccessSecretformat and then Base64-encode the string.echo -n 'accessKey:secretKey' | base64Configure the component.
Enter the complete generated string in theBasic <Base64-encoded string>format into theAuthorizationfield ofprometheusHeader.... prometheus: prometheusHeader: - Authorization: Basic YWxxxxeQ== ...
Scenario 2: Open source Prometheus monitoring
For an open source, self-managed Prometheus setup, you must expose the standard Prometheus access API through a Service. Then, configure the API in the Prometheus data source URL parameter of the metrics-adapter component. This completes the HPA data source configuration based on data from open source Prometheus.
The following example uses the ack-prometheus-operator community edition Helm Chart application from the ACK App Marketplace. For more information, see Open source Prometheus monitoring.
Deploy the Prometheus monitoring solution and expose the standard Prometheus API.
Log on to the ACK console. In the left navigation pane, choose .
On the App Marketplace page, search for and click ack-prometheus-operator. On the right side of the page, click Deploy.
On the creation page, select the Cluster and Namespace, modify the Release Name as needed, and then click Next. Modify the Parameters as needed, and then click OK.
View the deployment result.
Expose the standard Prometheus API through a Service. This example uses the `ack-prometheus-operator-prometheus` Service.
In a browser, visit `ServiceIP:9090`. To enable public network access for the Service using an SLB instance, view the Prometheus console.
In the menu bar at the top of the page, click to view all collection jobs.
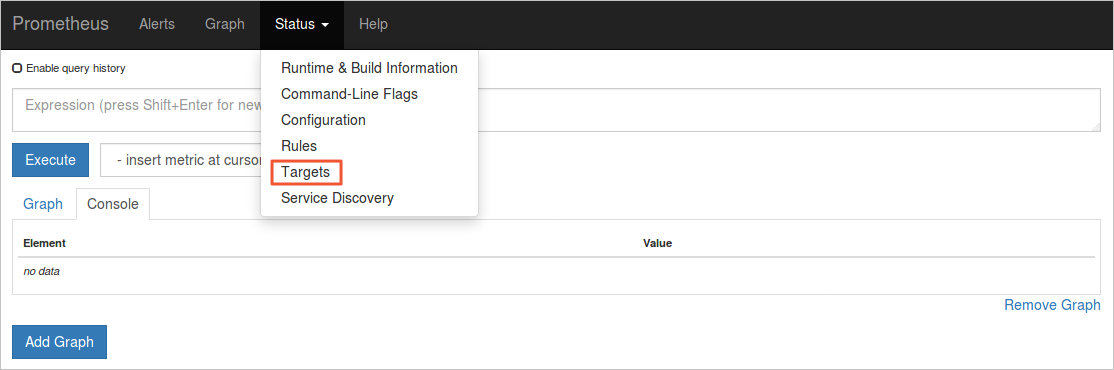
If the status of all jobs is UP, all collection jobs are running as normal.
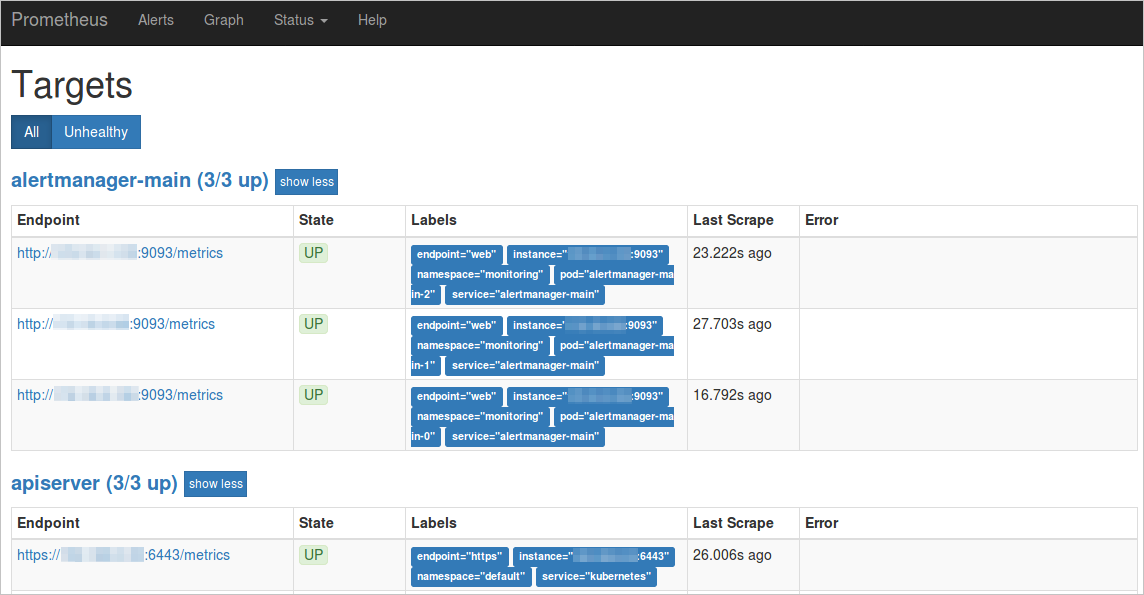
View the corresponding service and namespace in the Labels section.
This example uses a ServiceName of `ack-prometheus-operator-prometheus` and a ServiceNamespace of `monitoring` to illustrate the request URL for this open source Prometheus data.
http://ack-prometheus-operator-prometheus.monitoring.svc.cluster.local:9090
Configure the Prometheus data source URL parameter of the component to ensure normal communication between the component and Prometheus.
If you choose to access the standard Prometheus API over the public network, you can refer to the following example for the configuration.
  AlibabaCloudMetricsAdapter:
  ......
    prometheus:
      enabled: true
      url: http://your_domain.com:9090   # Replace your_domain.com with your public IP address.
For example, if you use the ack-prometheus-operator solution, the value of
urlishttp://ack-prometheus-operator-prometheus.monitoring.svc.cluster.local:9090.
For more information about how to obtain Prometheus data, see Add a Prometheus data source in Grafana.
Related documents
To implement HPA using external metrics, such as the HTTP request rate or Ingress QPS, see Horizontal pod autoscaling based on Alibaba Cloud component metrics.
To use Nginx Ingress for HPA on multiple applications and dynamically adjust the number of pod replicas based on application load, see Horizontally scale multiple applications based on Nginx Ingress traffic metrics.