Event monitoring is a monitoring method provided by Kubernetes. It provides improvements over resource monitoring in terms of timeliness, accuracy, and scenarios. You can use node-problem-detector (NPD) with the Kubernetes event center of Simple Log Service to monitor the cluster. Configure NPD for cluster diagnosis and enable offline archiving of abnormal events, then set up alert notifications through DingTalk and automated remediation through EventBridge.
Billing
By default, the event monitoring feature of ACK sinks cluster events to Simple Log Service. You can store and analyze events in Simple Log Service. The default retention period of ACK cluster events is 90 days. You can store ACK cluster events free of charge for 90 days. For more information, see Create and use an event center.
Background Information
Kubernetes is designed based on the state machine. Events are generated due to transitions between different states. Typically, Normal events are generated when the state machine changes to expected states and Warning events are generated when the state machine changes to unexpected states.
ACK provides out-of-the-box event monitoring solutions that target containerization scenarios. ACK uses NPD and kube-eventer provided by NPD to monitor container events.

NPD is a tool to diagnose Kubernetes nodes. NPD detects node exceptions, generates node events, and works with kube-eventer to raise alerts upon these events and enable closed-loop management of alerts. NPD generates node events when the following exceptions are detected: Docker engine hangs, Linux kernel hangs, outbound traffic exceptions, and file descriptor exceptions. For more information, see NPD.
kube-eventer is an open source event emitter that is maintained by ACK. kube-eventer sends Kubernetes events to sinks such as DingTalk, Simple Log Service, and EventBridge. kube-eventer also provides filter conditions to filter different levels of events. You can use kube-eventer to collect events in real time, trigger alerts upon specific events, and asynchronously archive events. For more information, see kube-eventer.
This topic describes how to configure event monitoring in the following scenarios:
Scenario 1: Use NPD with the Kubernetes event center of Simple Log Service to sink cluster events
NPD works with third-party plug-ins to detect node exceptions and generate cluster events. A Kubernetes cluster also generates events when the status of the cluster changes. For example, when a pod is evicted or an image pull operation fails, a related event is generated. The Kubernetes event center of Simple Log Service collects, stores, and visualizes cluster events. It allows you to query and analyze these events, and configure alerts. You can sink cluster events to the Kubernetes event center of Simple Log Service by using the following methods.
Step 1: Install the ack-node-problem-detector component
If you have selected Install node-problem-detector and Create Event Center when you create the cluster, proceed to Step 2 to view the Kubernetes event center. For more information about how to install the ack-node-problem-detector component when you create a cluster, see Create an ACK managed cluster.
If you did not select Install node-problem-detector and Create Event Center when you create the cluster, perform the following steps to manually install it.
Log on to the ACK console. In the navigation pane on the left, click Clusters.
On the Clusters page, find the one you want to manage and click its name. In the navigation pane on the left, click Add-ons.
On the Logs and Monitoring tab, find and install ack-node-problem-detector.
Step 2: View the event center
Log on to the ACK console. In the navigation pane on the left, click Clusters.
On the Clusters page, find the cluster you want and click its name. In the left-side pane, choose .
On the Event Center page, click the Event Overview (Event Center) tab to view information about Kubernetes events.
You can view all Kubernetes events and their detailed information and pod lifecycle. For more information, see Collect Kubernetes events.
Scenario 2: Configure NPD to diagnose a cluster and send events of exceptions to sinks
NPD integrated with kube-eventer enables closed-loop management of alerts for node events. To do this, perform the following steps:
Procedure
Refer to Install the ack-node-problem-detector component to install the ack-node-problem-detector component.
NoteIf the ack-node-problem-detector component is already installed, reinstall it. For more information, see Reinstall the ack-node-problem-detector component.
On the Clusters page, find the cluster you want and click its name. In the left-side pane, choose .
On the DaemonSets tab, select the kube-system namespace, and check whether ack-node-problem-detector-daemonset is running as expected.
When both NPD and
eventerwork as expected, the system sinks events and raises alerts based on theeventerconfigurations.
Node diagnosis plug-ins supported by NPD
Plug-in | Feature | Description |
fd_check | Checks whether the percentage of opened file descriptors on each cluster node exceeds a maximum of 80% | The default threshold is 80%. The threshold is adjustable. This plug-in consumes a considerable amount of resources to perform the check. We recommend that you do not enable this plug-in. |
ram_role_check | Checks whether cluster nodes are assigned the required RAM role and whether the AccessKey ID and AccessKey secret are configured for the RAM role | None |
ntp_check | Checks whether the system clocks of cluster nodes are properly synchronized through Network Time Protocol (NTP) | This plug-in is enabled by default. |
nvidia_gpu_check | Checks whether the NVIDIA GPUs of cluster nodes can generate | None |
network_problem_check | Checks whether the | This plug-in is enabled by default. |
inodes_usage_check | Checks whether the | The default threshold is 80%. The threshold is adjustable. This plug-in is enabled by default. |
csi_hang_check | Checks whether the Container Storage Interface (CSI) plug-in works as expected on cluster nodes | None |
ps_hang_check | Checks whether processes in the uninterruptible sleep (D) state exist in the systems of cluster nodes | None |
public_network_check | Checks whether cluster nodes can access the Internet | None |
irqbalance_check | Checks whether the | None |
pid_pressure_check | Checks whether the ratio of | This plug-in is enabled by default. |
docker_offline_check | Checks whether the | This plug-in is enabled by default. |
Scenario 3: Implement Kubernetes monitoring and alerting with DingTalk chatbot
Using a DingTalk chatbot to monitor and alert on Kubernetes events is a typical ChatOps implementation. To do this, perform the following steps.
Add a DingTalk chatbot.
Click
 in the upper-right corner of the chatbox of a DingTalk group to open the Group Settings page.
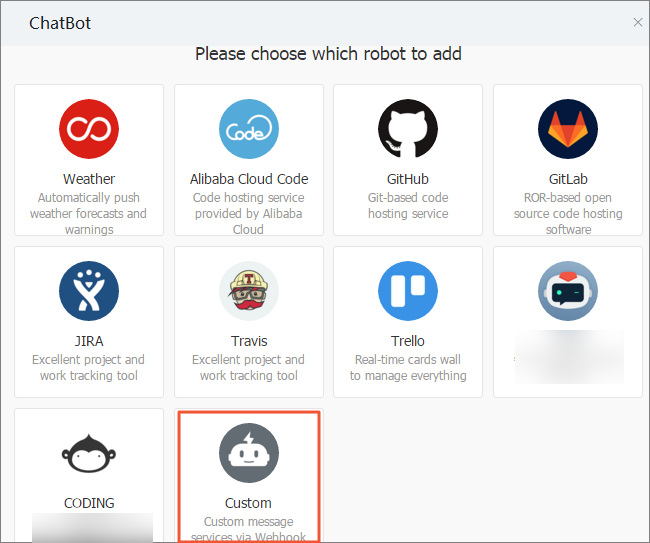
 Click Bot and click Add Robot to add a chatbot. Custom is selected in this example.
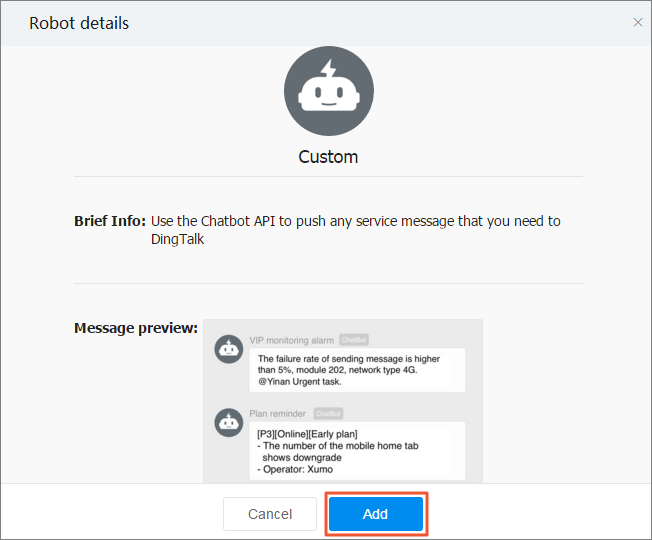
On the Robot details page, click Add to open the Add Robot page.
Set the following parameters, read and accept the DingTalk Custom Robot Service Terms of Service, and then click Finished.
Parameter
Description
Edit profile picture
The avatar of the chatbot. This parameter is optional.
Chatbot name
The name of the chatbot.
Add to Group
The DingTalk group to which the chatbot is added.
Security settings
Three types of security settings are supported: custom keywords, additional signatures, and IP addresses (or CIDR blocks).
Only Custom Keywords are supported for filtering alerts that are raised upon cluster events.
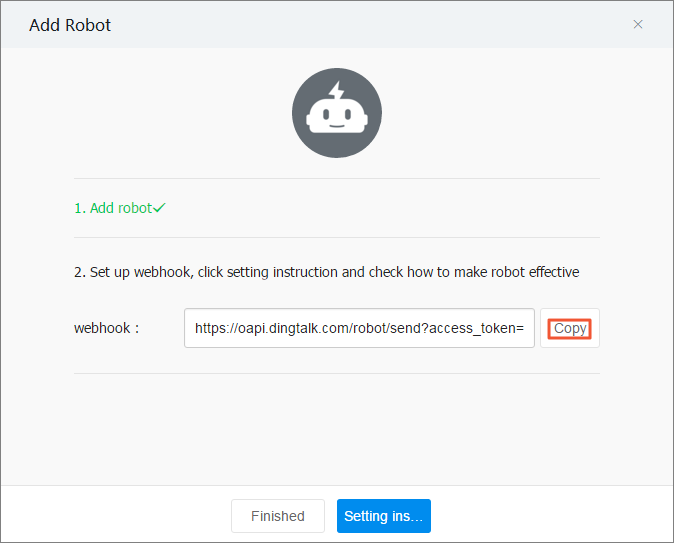
Select Custom Keywords and enter
Warningto receive alerts. If the chatbot frequently sends messages, you can add more keywords to filter the messages. You can add up to 10 keywords. Messages from ACK are also filtered through these keywords before the chatbot sends them to the DingTalk group.Click Copy to copy the webhook URL.
 Note
NoteOn the ChatBot page, find the chatbot and click
 to perform the following operations:
Modify the avatar and name of the chatbot.
Enable or disable message push.
Reset the webhook URL.
Remove the chatbot.
Install the ack-node-problem-detector component. For more information, see Install the ack-node-problem-detector component.
NoteIf the ack-node-problem-detector component is already installed, reinstall it. For more information, see Reinstall the ack-node-problem-detector component.
Update the ack-node-problem-detector component.
On the Clusters page, find the cluster you want and click its name. In the left-side navigation pane, choose .
On the Helm page, find the ack-node-problem-detector component. Then, click Update in the Actions column of the component, modify the following parameters, and click OK.
In the
npdsection, set theenabledparameter tofalse.Set
eventer.sinks.dingtalk.enabledtotrue.Enter the token contained in the webhook URL generated in the preceding step.
Expected output:
eventer takes effect 30 seconds after the deployment is complete. When an event whose severity level exceeds the threshold occurs, an alert is sent to the DingTalk group. 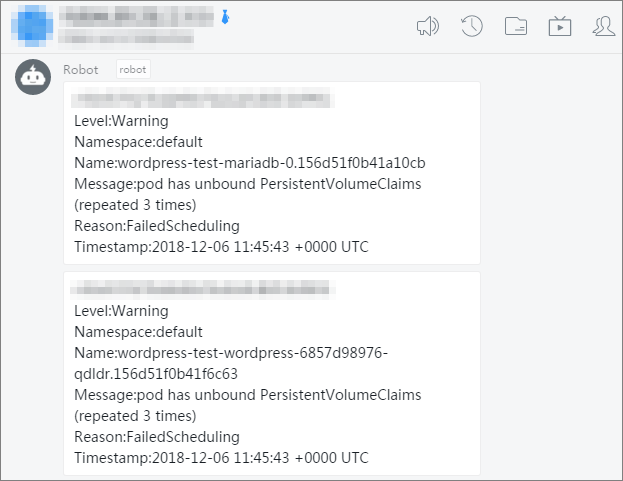
Scenario 4: Sink Kubernetes events to Simple Log Service
You can sink Kubernetes events to Simple Log Service for persistent storage, and archive and audit these events. For more information, see Create and use an event center.
Create a Simple Log Service project and a Logstore.
Log on to the Simple Log Service console.
In the Projects section, click Create Project. In the Create Project panel, set the parameters and click Create.
In this example, a Simple Log Service project named k8s-log4j is created in the China (Hangzhou) region where the monitored ACK cluster is deployed.
NoteWe recommend that you create a Simple Log Service project in the same region as your cluster. When a Simple Log Service project and a cluster are deployed in the same region, the log is transmitted over the internal network. This enables the real-time collection and quick retrieval of log data. This also avoids cross-region transmission, which requires additional bandwidth and time costs.
In the Projects section, find and click the k8s-log4j project. The details page of the project appears.
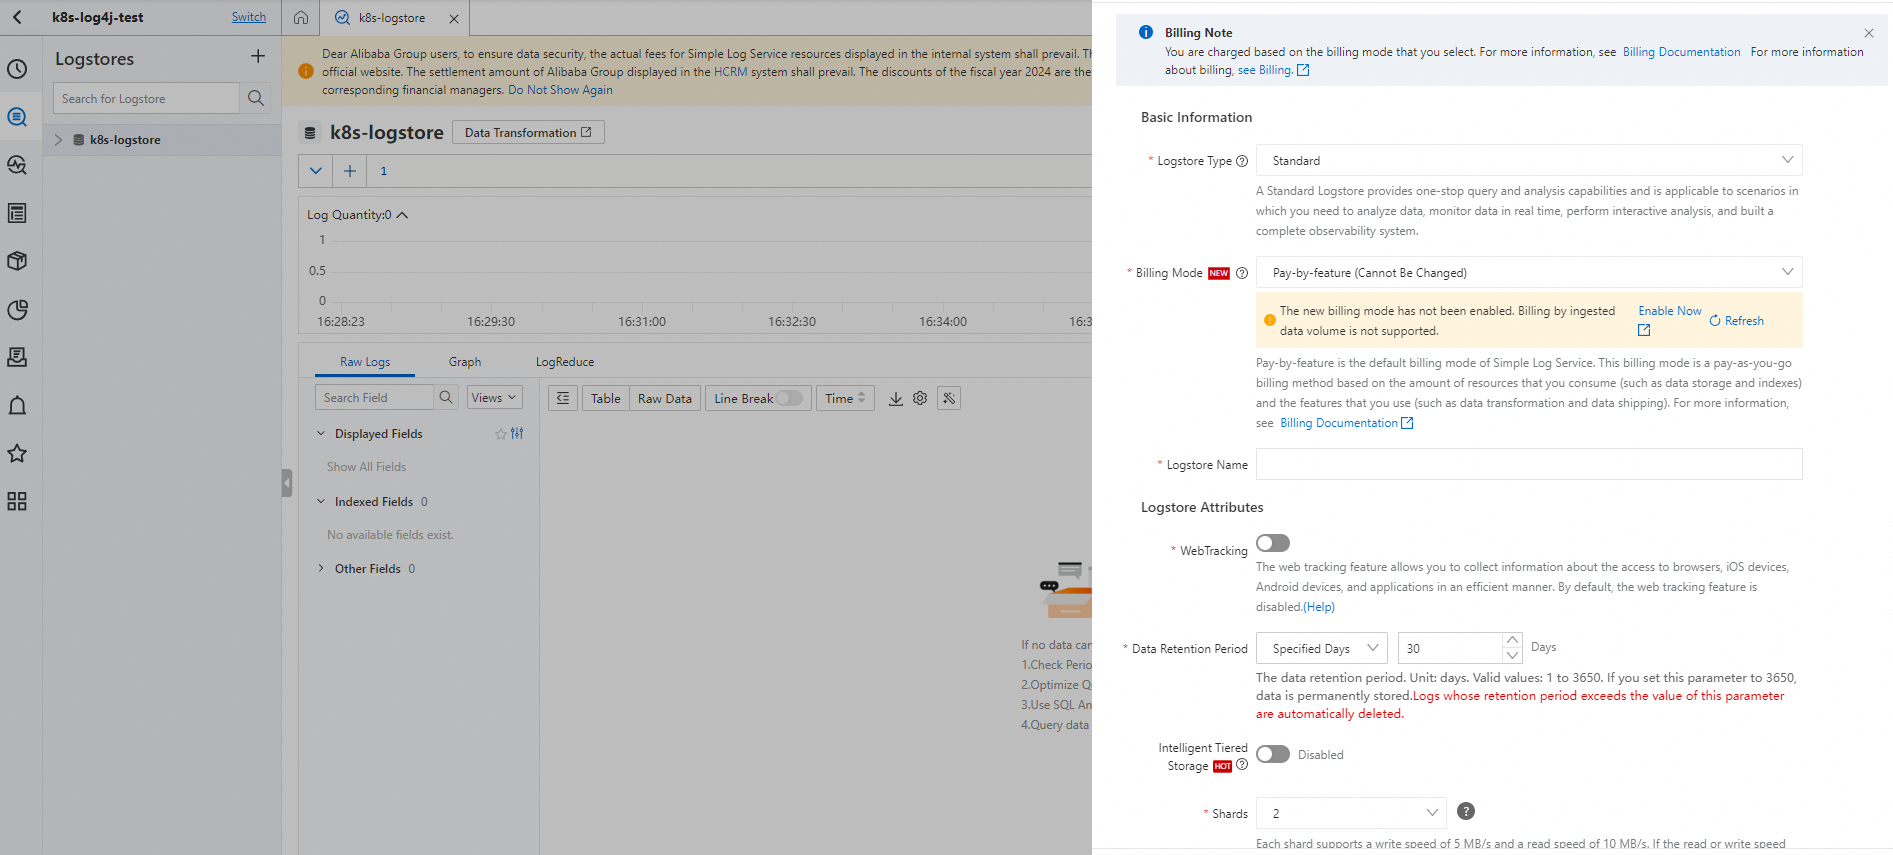
On the left Logstores pane, click the + icon to open the Create Logstore panel.
In the Create Logstore panel, set the parameters and click OK.
In this example, a Logstore named k8s-logstore is created.
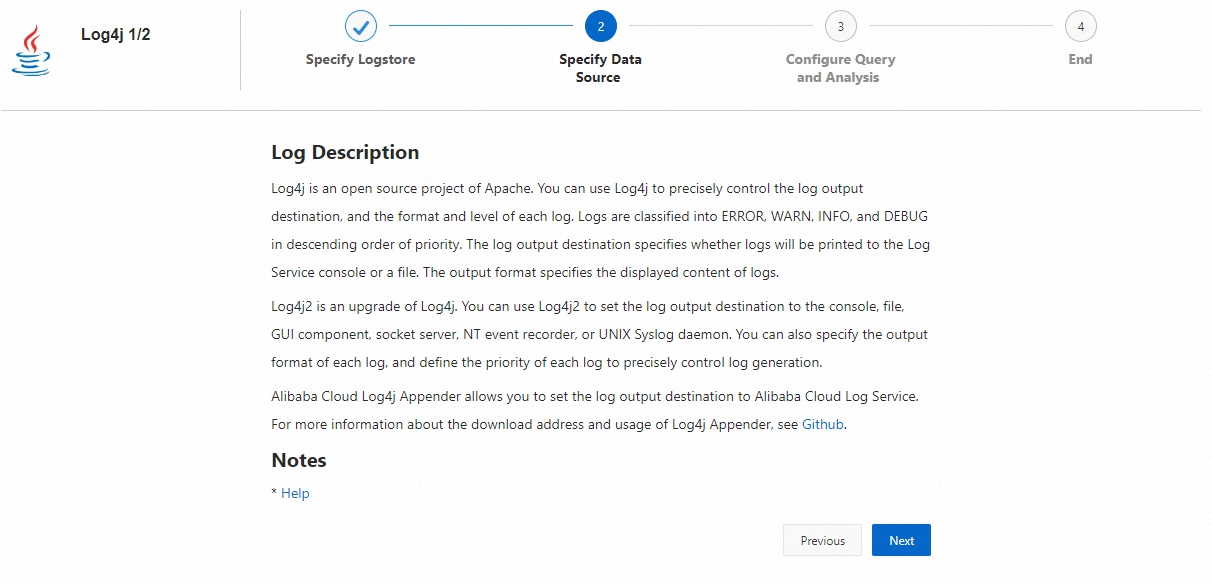
After the k8s-logstore Logstore is created, instructions on how to use the Data Import wizard appear on the page. Click Data Import Wizard. The Import Data dialog box appears.
Select Log4j 1/2 and configure the settings by following the steps on the page.
In this example, the default settings are used. You can also customize the settings to meet your business requirements.
Configure log4j for the cluster.
Refer to Install the ack-node-problem-detector component to install the ack-node-problem-detector component.
ImportantWhen you install the ack-node-problem-detector component, specify the
projectandLogstorethat you created in Step 1.If the ack-node-problem-detector component is already installed, reinstall it. For more information, see Reinstall the ack-node-problem-detector component.
On the Clusters page, find the cluster you want and click its name. In the left-side navigation pane, choose .
On the Helm page, find the ack-node-problem-detector component. Then, click Update in the Actions column of the component, modify the following parameters, and click OK.
In the
npdsection, set theenabledparameter tofalse.Set
eventer.sinks.sls.enabledtotrue.
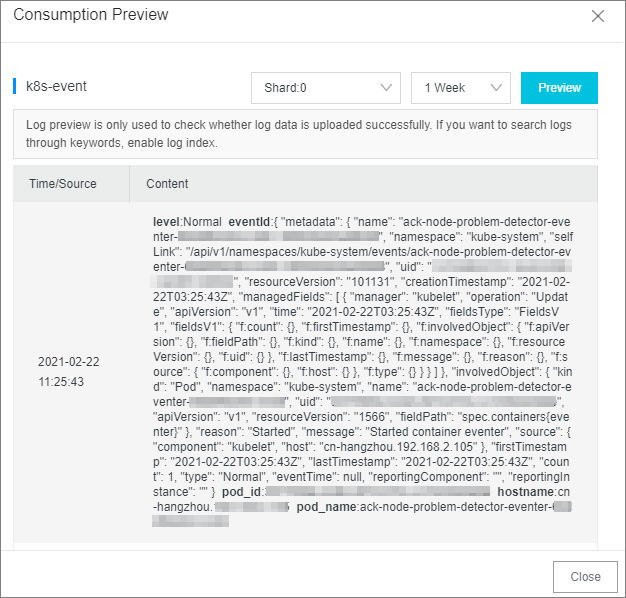
An event is generated after an operation is performed on the cluster, such as a pod deletion or an application creation. You can log on to the Simple Log Service console to view the collected log data. For more information, see Consume log data by using Simple Log Service SDK.
Set indexes and archiving. For more information, see Create indexes.
Log on to the Simple Log Service console. In the Projects section, find and click the name of the project.
Click
 next to the name of the Logstore and then select Search & Analysis.
 In the upper-right corner of the page that appears, click Enable Index.
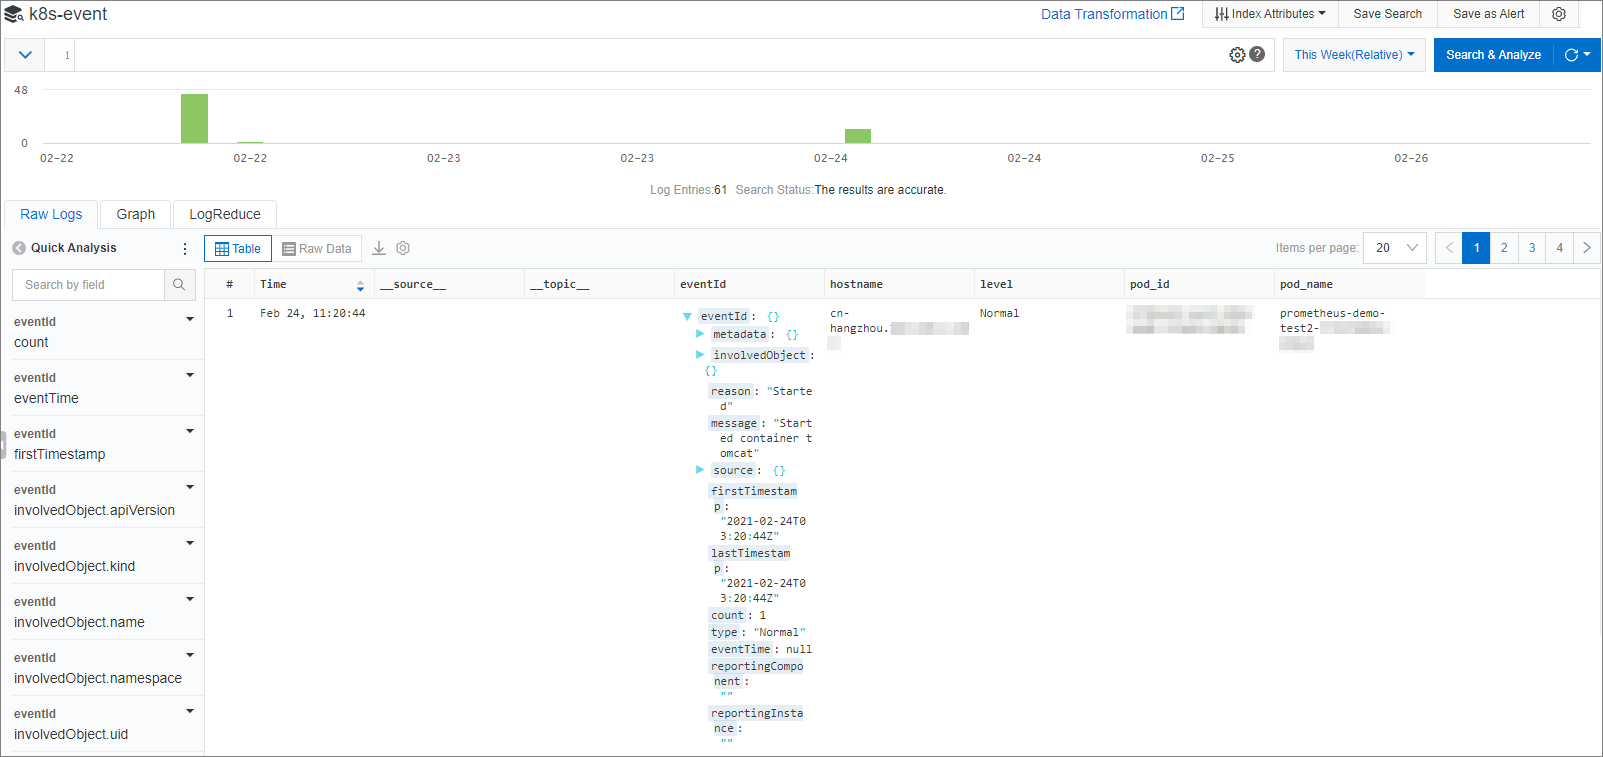
In the Search & Analysis panel, set the parameters, and click OK.
The log query and analysis page appears.
 Note
NoteThe index configuration takes effect within 1 minute.
A newly enabled or modified index applies only to data that is imported after the index is enabled or modified.
(Optional) In scenarios requiring offline archiving and computing, you can ship data from the Logstore to MaxCompute or Object Storage Service (OSS). For more information, see Create a data shipping job of the new version to ship data to MaxCompute and Create an OSS data shipping job (new version).
Scenario 5: Sink Kubernetes events to EventBridge
EventBridge is a serverless event service provided by Alibaba Cloud. Alibaba Cloud services, custom applications, and software as a service (SaaS) applications can connect to EventBridge in a standardized and centralized manner. ACK events can be sunk to EventBridge, which allows you to build a loosely-coupled and distributed event-driven architecture in EventBridge. For more information about EventBridge, see What is EventBridge?.
Activate EventBridge. For more information, see Activate EventBridge and grant permissions to a RAM user.
Refer to Install the ack-node-problem-detector component to install the ack-node-problem-detector component.
NoteIf the ack-node-problem-detector component is already installed, reinstall it. For more information, see Reinstall the ack-node-problem-detector component.
On the Clusters page, find the cluster you want and click its name. In the left-side navigation pane, choose .
On the Helm page, find the ack-node-problem-detector component. Then, click Update in the Actions column of the component, set
eventer.sinks.eventbridge.enabletotrueto enable EventBridge as a sink of Kubernetes events, and click OK.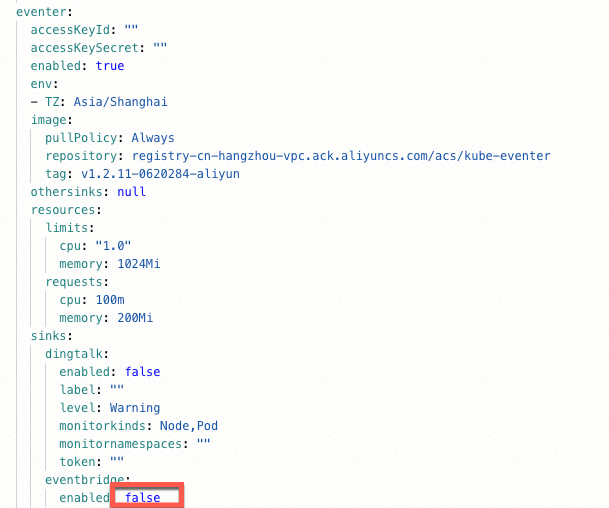
After EventBridge is enabled as a sink of Kubernetes events, you can view Kubernetes events in the EventBridge console.
Log on to the EventBridge console.
In the left-side navigation pane, click Event Buses.
- On the Event Buses page, click the name of the target event bus.
- In the left-side navigation pane, click Event Tracking.
Select a query method, set query conditions, and then click Query.
In the list of events, find the event that you want to view and click Details in the Actions column.
For more information, see Query events by event ID.
Reinstall the ack-node-problem-detector component
Log on to the ACK console. In the navigation pane on the left, click Clusters.
On the Clusters page, find the cluster that you want to manage and click its name. In the left-side pane, choose .
On the Jobs page, click More on the right side of kube-eventer-init-v1.7-xxxx and click Delete.
On the Clusters page, find the cluster that you want to manage and click its name. In the left-side pane, choose .
On the Helm page, delete the ack-node-problem-detector component.
On the Clusters page, find the cluster that you want to manage and click its name. In the left-side navigation pane, choose .
On the Logging and Monitoring tab, find and reinstall ack-node-problem-detector.