If you enabled the monitoring feature for your scaling group, you can view the following metrics of the Elastic Compute Service (ECS) instances in your scaling group: CPU utilization, memory usage, load, system disk BPS and IOPS, and network bandwidth. These metrics help you dynamically obtain the resource utilization in your scaling group.
Background Information
This topic describes only metrics of ECS instances. You can view the following metrics if your scaling group is of the ECS type:
CPU, Memory, and Load Metrics: CPU Utilization (%), Memory Usage (%), and Loads.
System Disk Metrics: System Disk Read/Write BPS (byte/s) and System Disk IOPS (count/s)
Network Metrics: Public Bandwidth (bit/s) and Internal Bandwidth (bit/s).
QPS Metric: (ALB) QPS per Backend Server
For more information about system metrics, see Event-triggered tasks of the system monitoring type.
Procedure
- Log on to the Auto Scaling console.
- In the left-side navigation pane, click Scaling Groups.
- In the top navigation bar, select the region where Auto Scaling is activated.
- Find a scaling group and use one of the following methods to go to the scaling group details page:
- Click the ID of the scaling group in the Scaling Group Name/ID column.
- Click Details in the Actions column.
In the upper part of the page that appears, click the Monitoring tab.
View the changing metric statistics of the ECS instances in your scaling group.
In the following figure, the CPU, Memory, and Load Metrics category is used as an example.
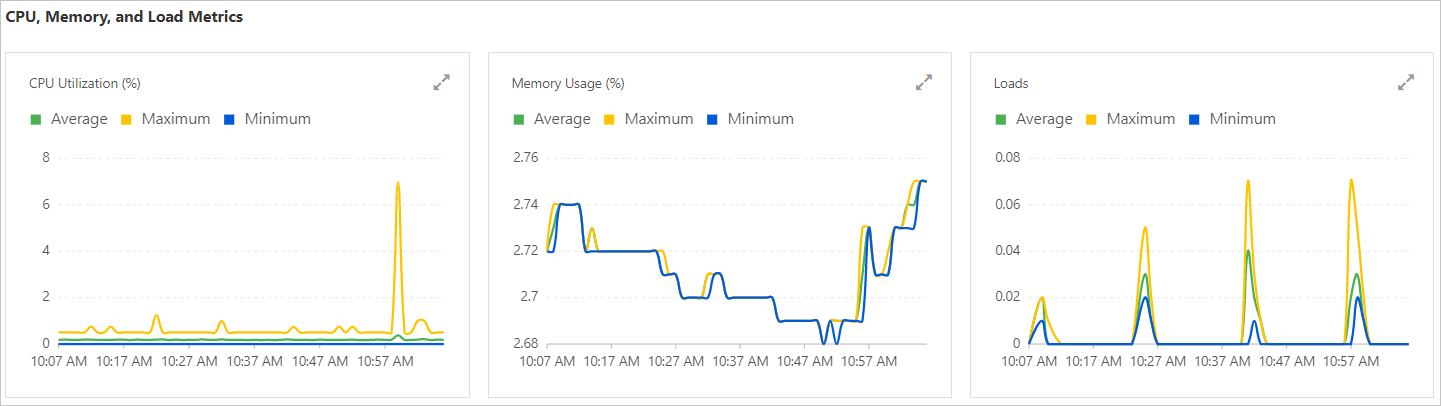
You can click a monitoring dimension such as Average or Maximum in the upper part of the monitoring chart to hide or show relevant data in the chart.
You can click
 to zoom in the chart. You can also select a time range in the enlarged monitoring chart to view data of a specific time period.
 If a monitoring chart has no data, no event-triggered tasks of the metric are created. Create an event-triggered task as prompted. For information about how to create an event-triggered task, see Manage event-triggered tasks.
The chart varies based on the metric that you select when you create an event-triggered task. For example, if you set the Monitoring Metric parameter to System Disk Read (Byte/s) or System Disk Write (Byte/s), you can view the chart of the System Disk Read/Write BPS (byte/s) metric in the System Disk Metrics section.
NoteFor more information about different metrics, see Event-triggered tasks of the system monitoring type. The metrics that are displayed in the Auto Scaling console shall prevail.