When you operate a service mesh, you need visibility into how traffic flows between services, where latency occurs, and what errors your workloads produce. Service Mesh (ASM) provides centralized observability controls for access logs, metrics, and distributed tracing. You can apply these controls at three levels of granularity -- globally, per namespace, or per workload -- so that different parts of your mesh can have independent observability configurations.
Prerequisites
Before you begin, make sure you have:
An ASM instance of version 1.17.2.35 or later. To create or upgrade an instance, see Create an ASM instance or Upgrade an ASM instance
Configuration scopes and inheritance
ASM supports three scopes for observability settings.
| Scope | What it covers | Constraints |
|---|---|---|
| Global | Logs, metrics, and tracing for the entire mesh | Exactly one global configuration exists and cannot be deleted. Tracing settings are only available at this level (before version 1.24.6.83). |
| Namespace | Logs and metrics for a single namespace | Each namespace supports at most one namespace-level configuration. |
| Custom | Logs and metrics for workloads that match specific labels | Each workload can be matched by at most one custom configuration. |
Apply settings at each scope
All three scopes share the same starting steps. The difference is which tab you select and what additional parameters you provide.
Global scope
Log on to the ASM console. In the left-side navigation pane, choose Service Mesh > Mesh Management.
On the Mesh Management page, click the name of your ASM instance. In the left-side navigation pane, choose Observability Management Center > Observability Settings.
On the Observability Settings page, click the Global tab, configure logs, metrics, and tracing as needed, and then click Submit.
Namespace scope
Log on to the ASM console. In the left-side navigation pane, choose Service Mesh > Mesh Management.
On the Mesh Management page, click the name of your ASM instance. In the left-side navigation pane, choose Observability Management Center > Observability Settings.
On the Observability Configuration page, click the Namespace tab, click Create, select the target Namespace, configure logs and metrics as needed, and then click Create.
Custom (workload) scope
Log on to the ASM console. In the left-side navigation pane, choose Service Mesh > Mesh Management.
On the Mesh Management page, click the name of your ASM instance. In the left-side navigation pane, choose Observability Management Center > Observability Settings.
On the Observability Configuration page, click the Custom tab, select the target Namespace, click Create, enter a Name and Matching Labels, configure logs and metrics as needed, and then click Create.
The following sections describe each configuration area in detail.
Configure access logs
Enable or disable log output
In the Log Settings area, turn the Enable Log Output switch on or off.
On: The Envoy proxy on the data plane outputs access logs to the container's standard output.
Off: The Envoy proxy stops writing access logs to the container's standard output.
After you enable log output, verify that logs are flowing.
View Waypoint logs
kubectl -n istio-egress logs deployments/waypoint | tail -1 | jqView ingress gateway logs
kubectl -n istio-system logs istio-ingressgateway-6cff9b6b58-r**** --tail 1(Optional) View access logs in the ACK console
If your workloads run in a Container Service for Kubernetes (ACK) cluster, you can also view access logs through the ACK console:
Log on to the ACK console. In the left-side navigation pane, choose Clusters.
On the Clusters page, click the name of the target cluster. In the left-side navigation pane, choose Workloads > Pods.
On the Pods page, click the name of the target pod, and then click the Logs tab to view the access log.
Set the log output format
This setting requires ASM version 1.20.6.36 or later. To upgrade, see Upgrade an ASM instance.
In the Log Settings area, set Log Output Format to one of the following:
| Format | Behavior |
|---|---|
| JSON | Access logs are written as JSON strings to the container's standard output. |
| TEXT | Access logs are written as plain text strings to the container's standard output. |
Customize the log format
You can add custom fields to the access log to capture values from request headers, response headers, or Envoy built-in attributes. This requires Enable Log Output to be turned on.
In the Log Settings area, select or modify fields as needed. To add a field, click the
 icon at the bottom of the field list. The default log fields in the Log Format area are required and cannot be modified. Example: To include the
 Accept-Encodingrequest header in the access log, set accessLogFormat key toaccept-encoding, Type to Request Properties, and accessLogFormat value toAccept-Encoding.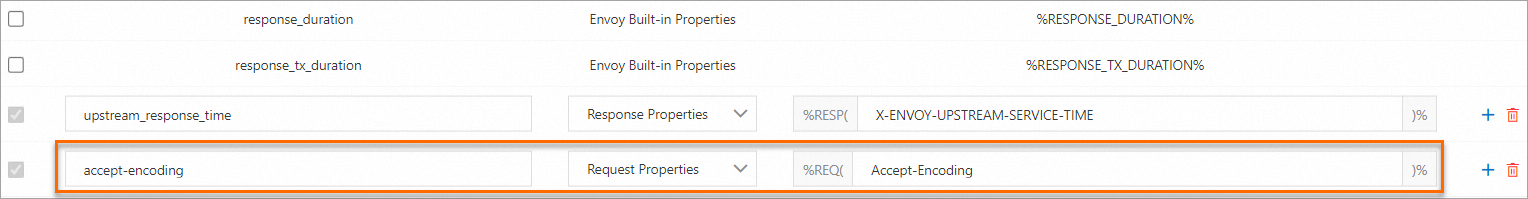
Run the following command to verify that the custom field appears in the logs:
kubectl logs httpbin-5c5944c58c-w**** -c istio-proxy --tail 1|grep accept-encoding --color=autoSample output (note the
accept-encodingfield at the bottom).
Filter access logs with CEL expressions
To log only requests that match specific criteria, select Enable Log Filter below the Log Settings area and enter a Common Expression Language (CEL) filtering expression. Requests that do not match the expression are excluded from the log output.
For example, to output logs only for requests with a response status code of 400 or higher, use the expression response.code >= 400.
CEL attribute reference
The following table lists commonly used attributes in CEL filter expressions. For more information, see CEL and Envoy attributes.
| Attribute | Type | Description |
|---|---|---|
request.path | string | Path of the request |
request.url_path | string | Path without the query string |
request.host | string | Hostname portion of the URL |
request.method | string | HTTP method |
request.headers | map<string, string> | All request headers, indexed by lowercase header name |
request.useragent | string | Value of the User-Agent header |
request.time | timestamp | Time when the first byte of the request arrives |
request.id | string | Request ID |
request.protocol | string | Protocol: HTTP/1.0, HTTP/1.1, HTTP/2, or HTTP/3 |
request.query | string | Query string from the request URL |
response.code | int | HTTP response status code |
response.code_details | string | Response code details |
response.grpc_status | int | gRPC status code |
response.headers | map<string, string> | All response headers, indexed by lowercase header name |
response.size | int | Response body size in bytes |
response.total_size | int | Total response message size in bytes |
Configure metrics
Enable or disable metrics
ASM collects two categories of metrics depending on whether the Envoy proxy is acting as a client or a server:
| Category | When generated | Traffic types |
|---|---|---|
| Client-side metrics | When Envoy initiates outbound requests | Sidecar egress traffic (application-to-application through a sidecar) and gateway traffic |
| Server-side metrics | When Envoy receives inbound requests | Sidecar ingress traffic (requests arriving at the proxied application) and Waypoint traffic |
To enable or disable individual metrics:
In the Metric Settings area, locate the Client-side Metrics (Gateway and Sidecar Outbound) or Server-side Metrics (Sidecar Inbound) column.
Select or clear the Enable checkbox for each metric.
Enabled: The Envoy proxy exposes the metric through the
/stats/prometheuspath on port 15020.Disabled: The metric is not exposed.
Run the following command to verify that the expected metrics are exposed: Sample output:
kubectl exec httpbin-5c5944c58c-w**** -c istio-proxy -- curl 127.0.0.1:15020/stats/prometheus|head -n 10# TYPE istio_agent_cert_expiry_seconds gauge istio_agent_cert_expiry_seconds{resource_name="default"} 46725.287654548 # HELP istio_agent_endpoint_no_pod Endpoints without an associated pod. # TYPE istio_agent_endpoint_no_pod gauge istio_agent_endpoint_no_pod 0 # HELP istio_agent_go_gc_duration_seconds A summary of the pause duration of garbage collection cycles. # TYPE istio_agent_go_gc_duration_seconds summary istio_agent_go_gc_duration_seconds{quantile="0"} 5.0149e-05 istio_agent_go_gc_duration_seconds{quantile="0.25"} 9.8807e-05 ......
Manage metric dimensions
Metric dimensions add labels to each metric, giving you finer-grained filtering in Prometheus. For example, use the source_app dimension to filter metrics by the originating application.
Removing unneeded default dimensions reduces memory consumption for both Envoy and Prometheus. Because most dimensions are typically retained, the Metric Settings area displays only the dimensions that have been removed.
Edit default dimensions
In the Metric Settings area, under Client-side Metrics (Gateway and Sidecar Outbound) or Server-side Metrics (Sidecar Inbound), click Edit dimension for the target metric.
In the Customize CLIENT dimension configuration or Customize SERVER dimension configuration dialog box, select or deselect dimensions, and then click Submit.
Example: With all dimensions enabled, the istio_request_bytes_sum metric (corresponding to REQUEST_SIZE on the dashboard) includes every label:
istio_request_bytes_sum{reporter="destination",source_workload="istio-ingressgateway",source_canonical_service="unknown",source_canonical_revision="latest",source_workload_namespace="istio-system",source_principal="spiffe://cluster.local/ns/istio-system/sa/istio-ingressgateway",source_app="istio-ingressgateway",source_version="unknown",source_cluster="c479fc4abd2734bfaaa54e9e36fb26c01",destination_workload="httpbin",destination_workload_namespace="default",destination_principal="spiffe://cluster.local/ns/default/sa/httpbin",destination_app="httpbin",destination_version="v1",destination_service="httpbin.default.svc.cluster.local",destination_canonical_service="httpbin",destination_canonical_revision="v1",destination_service_name="httpbin",destination_service_namespace="default",destination_cluster="c479fc4abd2734bfaaa54e9e36fb26c01",request_protocol="http",response_code="200",grpc_response_status="",response_flags="-",connection_security_policy="mutual_tls"} 18000After you reduce the server-side REQUEST_SIZE metric to retain only the response_code dimension, the output becomes:
istio_request_bytes_sum{response_code="200"} 16550Add custom dimensions
In the Metric Settings area, under Client-side Metrics (Gateway and Sidecar Outbound) or Server-side Metrics (Sidecar Inbound), click Edit dimension for the target metric.
In the Customize CLIENT dimension configuration or Customize SERVER dimension configuration dialog box, under Custom Dimension, enter the dimension name and value, and then click Submit.
Example: After you add request_path as the dimension name and request.path as the dimension value for the server-side REQUEST_SIZE metric, the output includes the new dimension:
istio_request_bytes_sum{response_code="200",request_path="/spec.json"} 5800Configure tracing
Tracing produces complete distributed traces only when all services in a call chain report spans to the same backend with compatible settings. If sampling rates or reporting endpoints differ between services, traces may be incomplete. For this reason, tracing settings are only available at the global level in versions earlier than 1.24.6.83.
In version 1.24.6.83 and later, ASM supports namespace-level and workload-level tracing configurations through the Telemetry custom resource. For more information, see Telemetry CRD.
Set the sampling percentage
Set the sampling percentage to control the proportion of requests that generate trace reports. A value of 0 disables tracing entirely.
Add custom tags
Add custom tags to trace spans for additional context. In the Tracing Analysis Settings section, click Add Custom Tags and configure the Name, Type, and Value.
The following table describes the available tag types with configuration examples.
| Type | Behavior | Example configuration |
|---|---|---|
| Fixed Value | The tag always carries the static value you specify. | Name: env, Type: Static value, Value: prod |
| Request Header | The tag value is read from the specified request header. If the header is missing, the default value is used. | Name: useragent, Type: Request Header, Header Name: User-Agent, Default Value: unknow |
| Environment Variable | The tag value is read from the specified environment variable on the workload. If the variable is missing, the default value is used. | Name: env, Type: environment variable, Environment Variable Name: ENV, Default Value: unknown |