After you report the data of an application to Managed Service for OpenTelemetry, Managed Service for OpenTelemetry can monitor the application. You can view the number of requests, number of errors, and response time on the Overview page.
Prerequisite
The data of the application that you want to monitor is reported to Managed Service for OpenTelemetry. For more information, see Integration guide.
View application overview
Log on to the ARMS console. In the left-side navigation pane, choose .
On the Applications page, select a region in the top navigation bar and click the name of the application.
NoteIf the
 icon is displayed in the Language column, the application is connected to Application Monitoring. If a hyphen (-) is displayed, the application is connected to Managed Service for OpenTelemetry.
 In the top navigation bar, click the Overview tab.
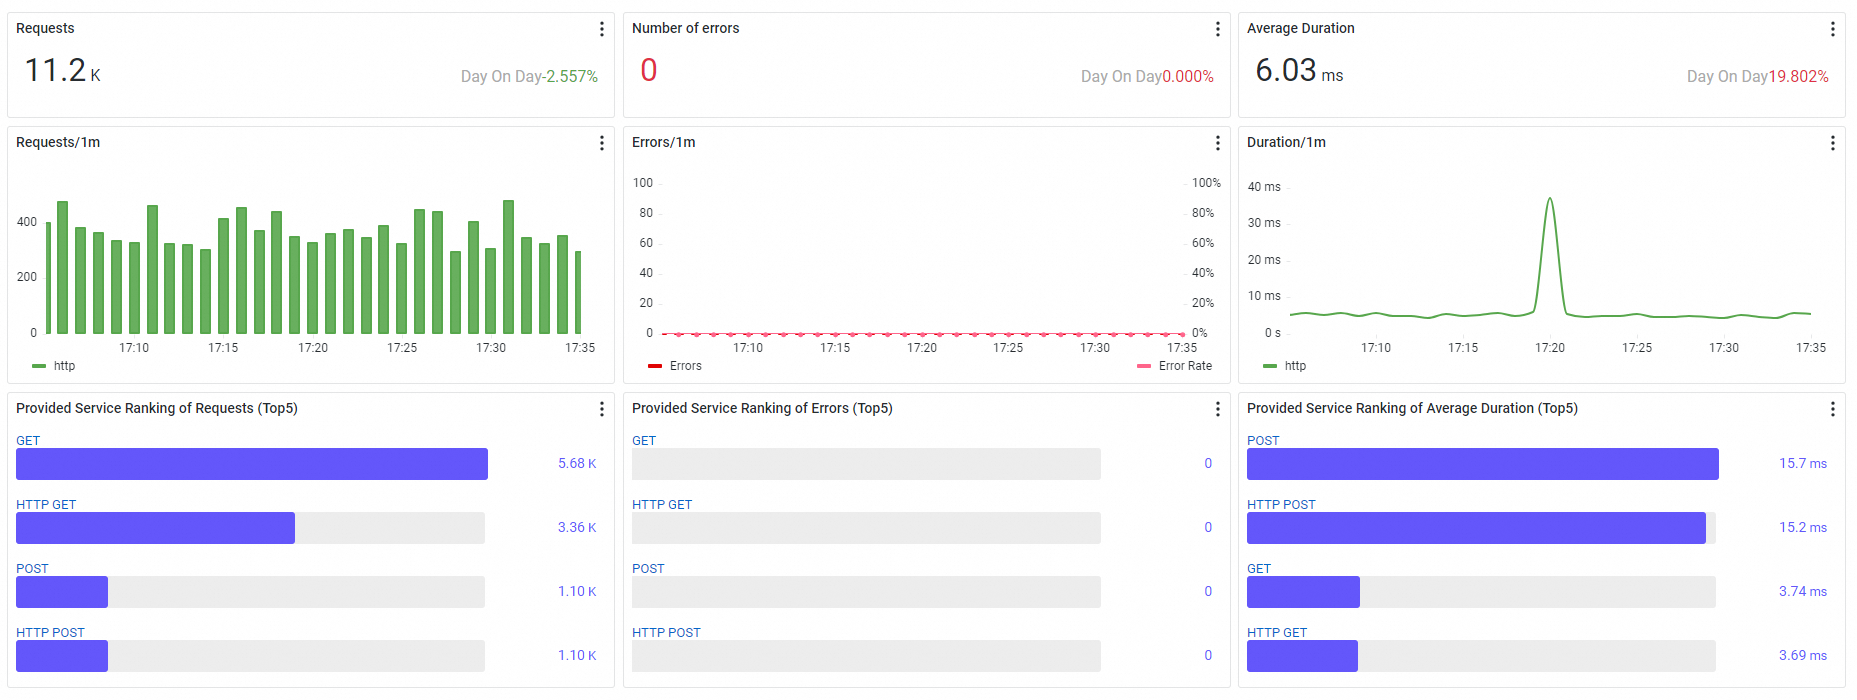
Dashboard
Metric | Display style | Description |
Requests | Ticker board | Displays the total number of requests of the application in the specified time period. Day On Day: the percentage of increase or decrease in the number of requests in the specified time period of the current day with the number of requests in the same time period of the previous day. |
Number of errors | Ticker board | Displays the total number of errors during the specified time period. Day On Day: the percentage of increase or decrease in the number of errors in the specified time period of the current day with the number of errors in the same time period of the previous day. |
Average Duration | Ticker board | Displays the average response time of the application requests in the specified time period. Day On Day: the percentage of increase or decrease in the average response time of the application requests in the specified time period of the current day with the average response time of the application requests in the same time period of the previous day. |
Requests | Column chart | Displays the trends in the number of requests in the specified time period. The columns with different call types are stacked on top of each other. |
Errors | Column chart with a trend line | Errors: the trend in the number of errors in an application within a specific time period. The trend is displayed in a bar chart. The left-side y-axis indicates the number of errors. Error Rate: the trends in the error rates in the specified time period. The right-side y-axis indicates the error rates. |
Duration | Trend chart | Displays the trends in the average response time of the application requests in the specified time period. Supported metrics: average response time, 99th percentile of the response time, 90th percentile of the response time, and 75th percentile of the response time. |
Provided Service Ranking of Requests | TOP 5 | Displays five services provided by the application with the most requests in the specified time period. Call types:
|
Provided Service Ranking of Errors | TOP 5 | Displays five services provided by the application with the most operation errors in the specified time period. Call types:
|
Provided Service Ranking of Average Duration | TOP 5 | Displays five services provided by the application with the longest response time in the specified time period. Call types:
|
Next steps
To prevent certain errors from being diagnosed, you can use the alerting feature to create alert rules for certain operations. When the specified errors occur, the system automatically notifies your O&M team. For more information about how to create an alert rule, see Application monitoring alert rules.