The ARMS Managed Service for Grafana includes the Log Service SLS data source plugin, allowing you to synchronize data from Log Service SLS to your Grafana dashboards without manual data migration. This lets you use Grafana's powerful real-time analysis and visualization features to monitor log data and optimize system performance. This topic shows you how to add Log Service SLS as a data source in Grafana and create a dashboard panel.
Prerequisites
You have created a Log Service SLS project. For more information, see Manage project.
You have created a logstore in Log Service SLS. For more information, see Manage logstore.
You have created an index for the logstore. For more information, see Create index.
Ensure the RAM user has the
AliyunLogReadOnlyAccessorAliyunLogFullAccesssystem permission to access the data source.
Step 1: Log on to Grafana
-
Log on to the ARMS console. In the left-side navigation pane, choose .
-
On the Workspace Management page, find the workspace that you want to manage and click the URL in the URL column to go to Grafana.
NoteYou can log on to Grafana with the administrator account of Grafana and the password that you configured when you created the workspace. You can also click Sign in with Alibaba Cloud to log on to Grafana with the current Alibaba Cloud account.
Step 2: Add the Log Service SLS data source
Grafana 9.0.x
In the left-side navigation pane of Grafana, choose
 > Data sources, and then click Add data source.
On the Add data source page, search for and click log-service-datasource.
On the settings page for log-service-datasource, configure the following parameters.
Parameter
Description
Name
The name of the data source. You can customize the name. Example:
log-service-datasource.Endpoint
The endpoint for accessing the project. You can find the endpoint on the Project Overview tab of your project on the Log Service SLS console. Example:
cn-beijing.log.aliyuncs.com. For more information, see Service Endpoints.Project
The name of the project from which you want to synchronize data. You can find the project name in the Project List section on the Log Service SLS console. Example:
k8s-log-c85aee79d9bfd437e9a518e**********.Logstore
The name of the logstore within the project from which you want to synchronize data. You can find the logstore name in your project. Example:
apiserver-c85aee79d9bfd437e9a518e**********.AccessKey ID
AccessKey ID: The AccessKey ID used to identify the user. For more information about how to obtain an AccessKey ID, see View the AccessKey information of a RAM user.
AccessKey secret: The AccessKey secret used to authenticate the user. You cannot view the AccessKey secret on the console. After you create the user, you must save the AccessKey secret.
AccessKey secret
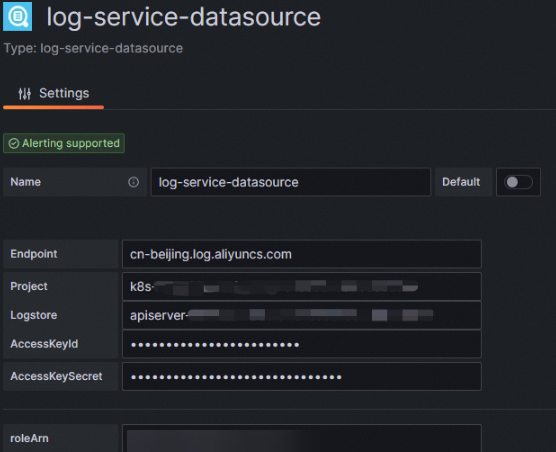
Click Save & test.
If the
Data source is workingmessage appears, the data source is added.
Grafana 10.0.x
On the Grafana homepage, click the
 icon.
icon. In the left-side navigation pane, choose .
On the Data sources tab, click + Add new data source.
On the Add data source page, search for and click log-service-datasource.
On the settings page for log-service-datasource, configure the following parameters.
Parameter
Description
Name
The name of the data source. You can customize the name. Example:
log-service-datasource.Endpoint
The endpoint for accessing the project. You can find the endpoint on the Project Overview tab of your project on the Log Service SLS console. Example:
cn-beijing.log.aliyuncs.com. For more information, see Service Endpoints.Project
The name of the project from which you want to synchronize data. You can find the project name in the Project List section on the Log Service SLS console. Example:
k8s-log-c85aee79d9bfd437e9a518e**********.Logstore
The name of the logstore within the project from which you want to synchronize data. You can find the logstore name in your project. Example:
apiserver-c85aee79d9bfd437e9a518e**********.AccessKey ID
AccessKey ID: The AccessKey ID used to identify the user. For more information about how to obtain an AccessKey ID, see View the AccessKey information of a RAM user.
AccessKey secret: The AccessKey secret used to authenticate the user. You cannot view the AccessKey secret on the console. After you create the user, you must save the AccessKey secret.
AccessKey secret
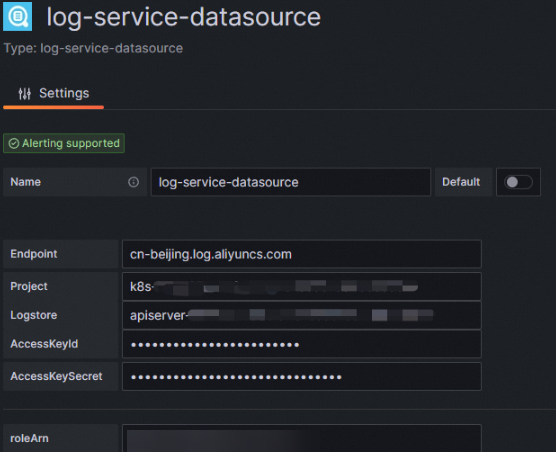
Click Save & test.
If the
Data source is workingmessage appears, the data source is added to Grafana.
Step 3: Create a dashboard panel
The following steps use a time series chart to display page views (PVs) as an example. For information about how to add other types of charts, see Add a dashboard.
Grafana 9.0.x
In the left-side navigation pane of Grafana, choose
 > New dashboard.
 On the New dashboard page, click Add a new panel.
On the Edit Panel page, on the Query tab, click the Data source drop-down list and select the data source that you added in Step 2.
Configure the parameters as described in the following table. Then, in the panel on the right, set the Title to PV.
Parameter
Description
Example
Query
The query statement for the data source.
Example query for PVs:
* | select count(*) as c, __time__-__time__%60 as t group by tycol
The metric to display on the Y-axis.
Based on the example query, set this to c, which represents the total number of logs.
xcol(time)
The metric to display on the X-axis, typically set to t for time.
Set this parameter to t.
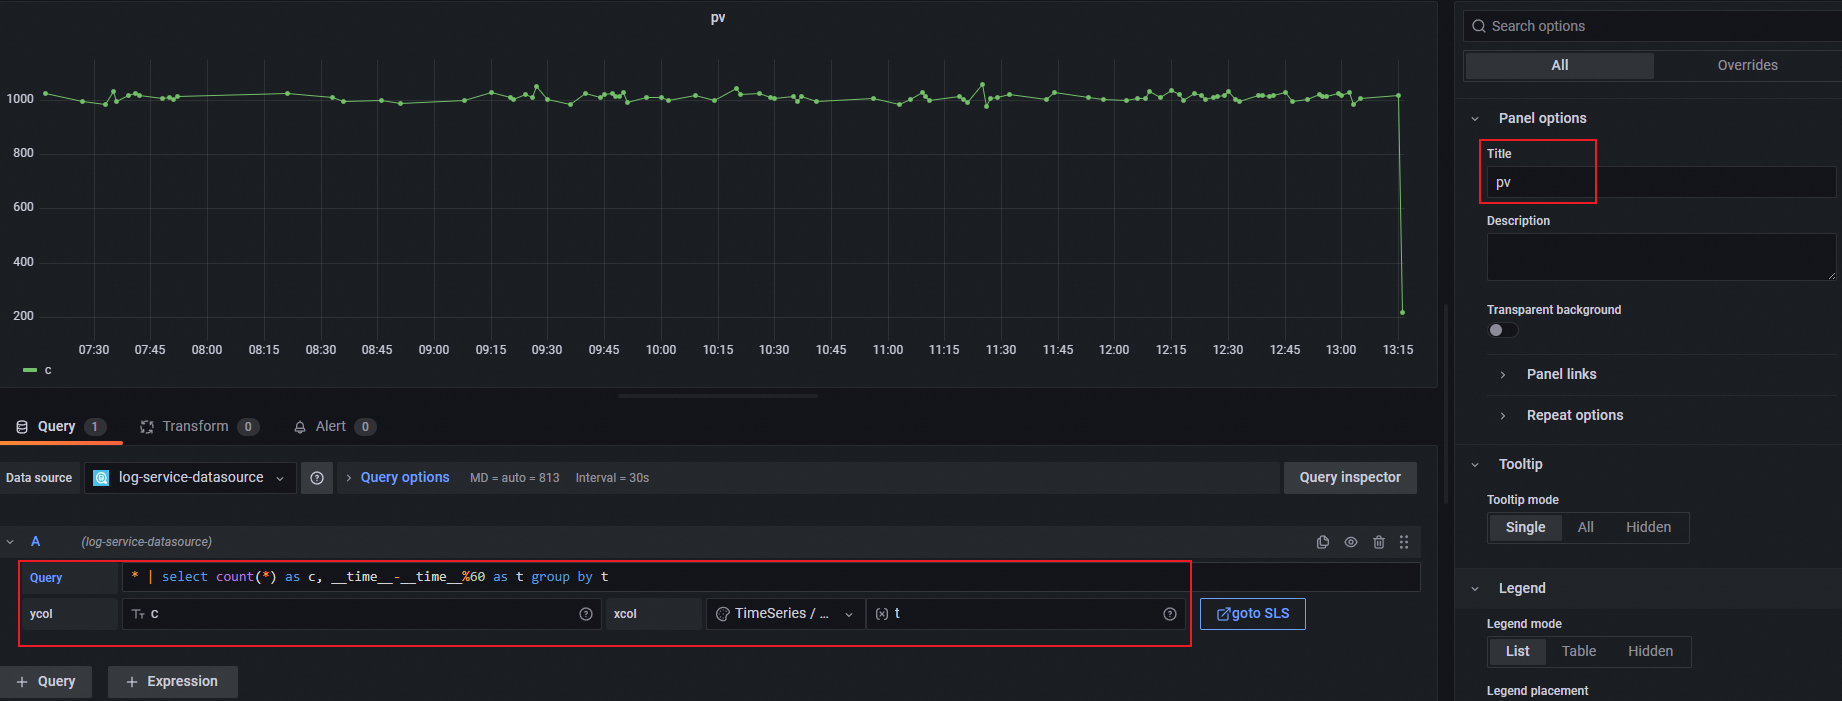
Click Apply.
In the upper-right corner, click the
 icon. Then, specify the name of the dashboard and the directory in which the dashboard resides.
 Click Save.
Grafana 10.0.x
On the Grafana homepage, click the
icon. In the left-side navigation pane, click Dashboards. On the page that appears, select New dashboard from the New drop-down list.
On the New dashboard page, click + Add visualization.
In the Select data source panel that appears on the right, select the data source that you added in Step 2.
Configure the parameters as described in the following table. Then, in the panel on the right, set the Title to PV.
Parameter
Description
Example
Query
The query statement for the data source.
Example query for PVs:
* | select count(*) as c, __time__-__time__%60 as t group by tycol
The metric to display on the Y-axis.
Based on the example query, set this to c, which represents the total number of logs.
xcol(time)
The metric to display on the X-axis, typically set to t for time.
Set this parameter to t.
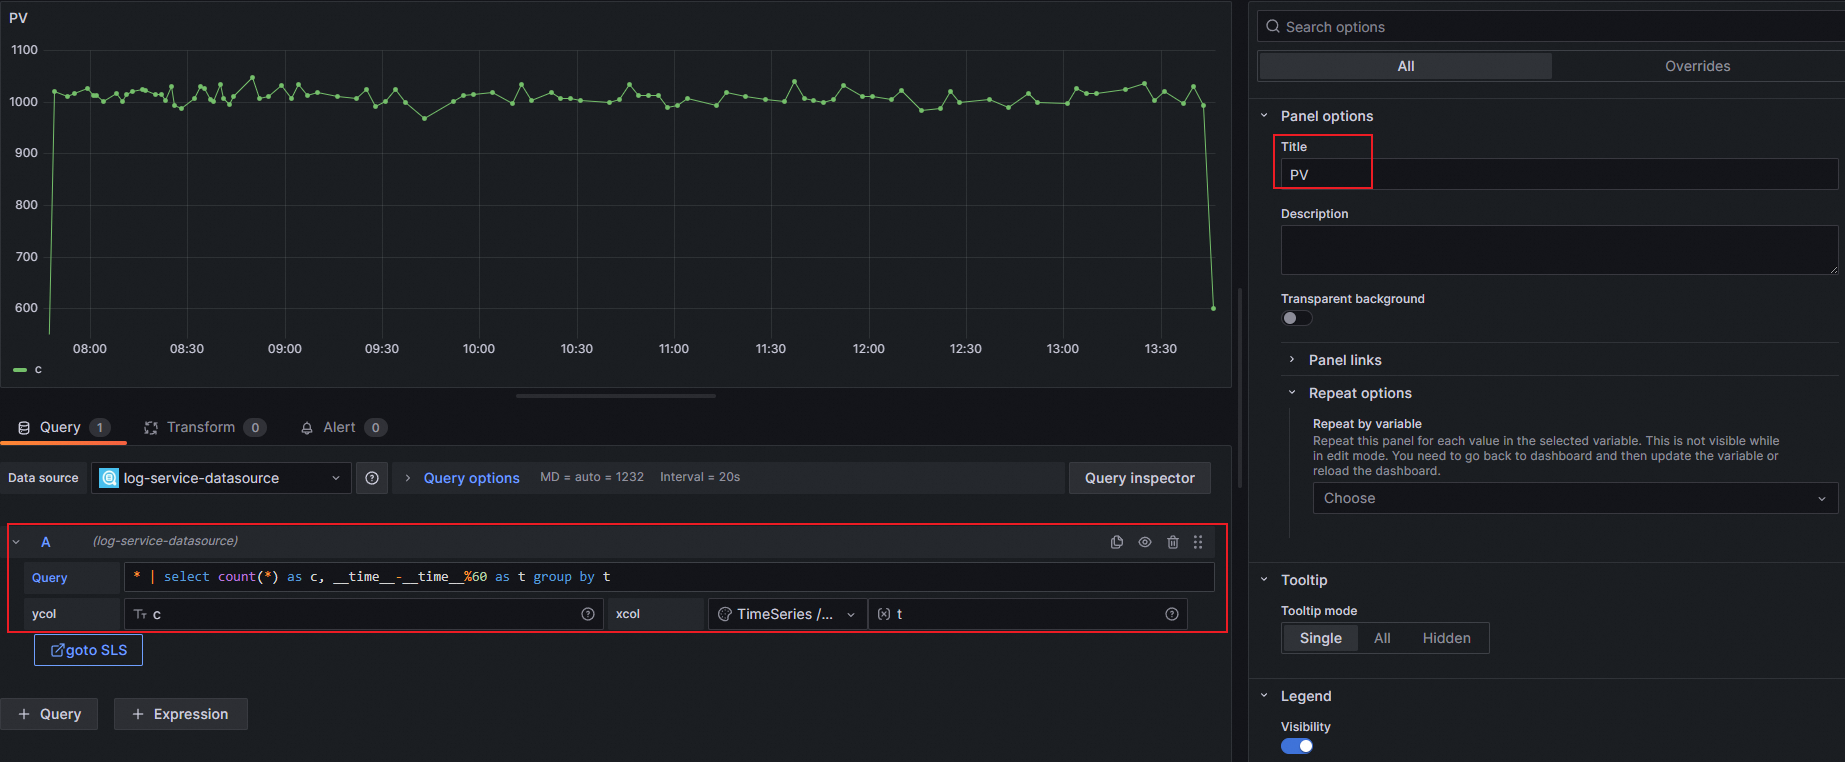
Click Apply.
In the upper-right corner, click the
icon. Then, specify the name of the dashboard and the directory in which the dashboard resides. Click Save.
Step 4: View monitoring data
Grafana 9.0.x
In the left-side navigation pane of Grafana, click the
icon.On the Browse tab, click the dashboard that you created in the destination folder to view all of its charts.
Grafana 10.0.x
In the left-side navigation pane of Grafana, choose Dashboards. Click the dashboard that you created in the destination folder to view all of its charts.
Related documentation
Log Service SLS supports both log data and time series data. To connect time series data to Grafana, see Connect time series data to Grafana.