If you want to specify RDS instances and metrics to monitor and compare the metrics of RDS instances, you can use the monitoring dashboard feature. This feature allows you to configure metric linkage. This provides you with an overall understanding of the health status of ApsaraDB RDS for MySQL instances.
Prerequisites
The feature is supported only for the following types of RDS instances:
MySQL 8.0 on RDS High-availability Edition, RDS Enterprise Edition, or RDS Cluster Edition
MySQL 5.7 on RDS High-availability Edition, RDS Enterprise Edition, or RDS Cluster Edition
MySQL 5.6 on RDS High-availability Edition
MySQL 5.5 on RDS High-availability Edition
Database Autonomy Service (DAS) provides the monitoring dashboard feature for ApsaraDB RDS for MySQL from May 20, 2022.
Create a monitoring dashboard
Log on to the ApsaraDB RDS console.
In the left-side navigation pane, choose Maintenance & Monitoring > Performance Monitoring.
On the Performance Monitoring page, click the Monitoring Dashboard tab.
On the SQL Server tab, click Add Monitoring Dashboard.
In the dialog box that appears, configure the Dashboard Name parameter and click OK.
Click Select Instances and Metrics, select the RDS instances and the metrics that are required, and then click the
 icon. Note
You can select up to 32 RDS instances at a time.
For more information about metrics, see Metrics.
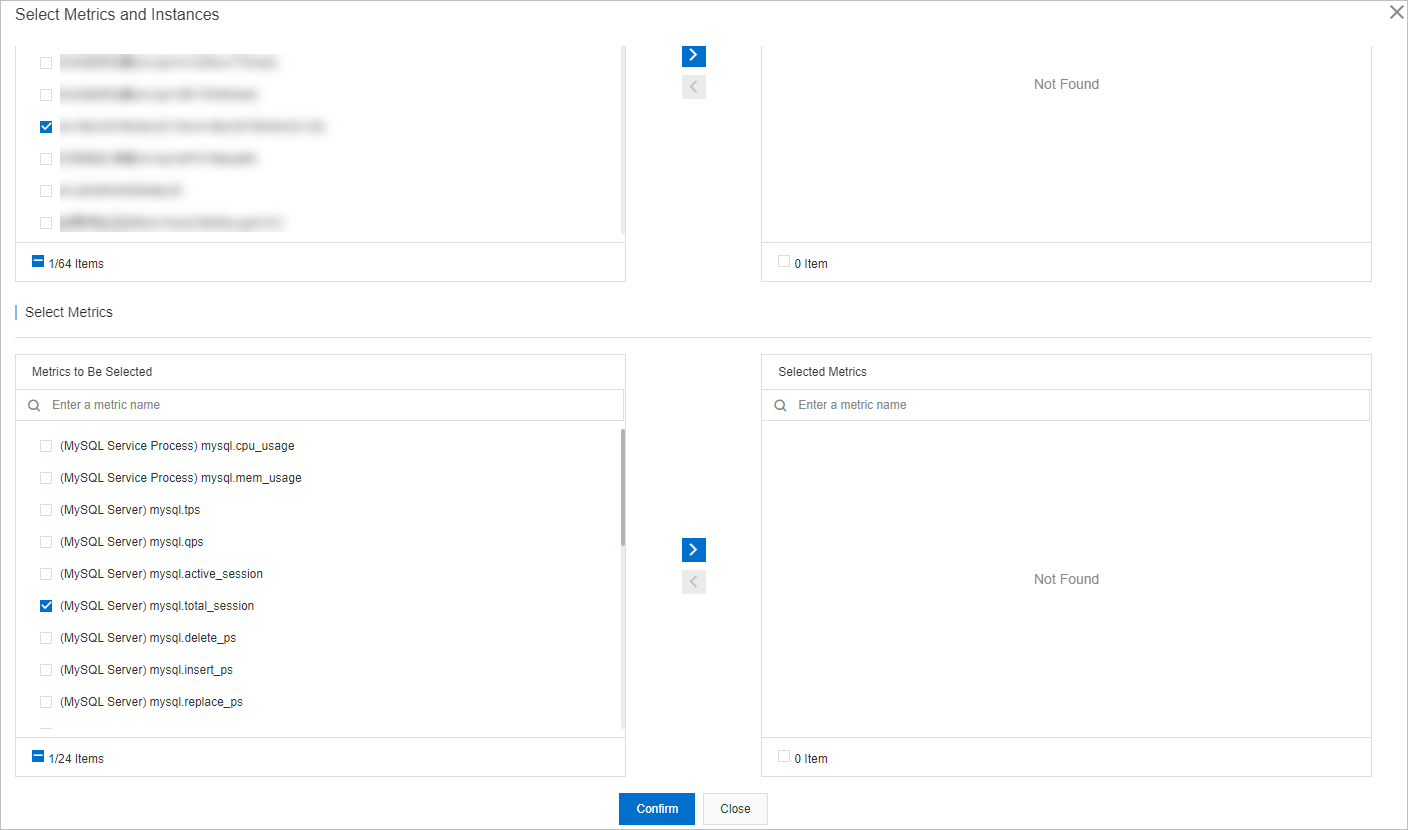
Click Confirm.
NoteTo modify the database instances or metrics in the monitoring dashboard, click Add Instances and Metrics.
View the metric trends of an RDS instance in the monitoring dashboard
Log on to the ApsaraDB RDS console.
In the left-side navigation pane, choose Maintenance & Monitoring > Performance Monitoring.
On the Performance Monitoring page, click the Monitoring Dashboard tab.
Click the tab for the database engine, select the monitoring dashboard that you want to view, and then specify a time range to view the trend charts of the metrics during the specified time range.
NoteWhen you select a time range, the end time must be later than the start time, and the interval between the start time and the end time cannot exceed seven days.
You can configure the Instance filtering parameter to filter for multiple RDS instances and then view and compare the metrics of the RDS instances.
You can turn on Auto Refresh (Every 5 Seconds) for the system to refresh the trend charts of the metrics every 5 seconds.
You can turn on Linkage Chart to view the values of different metrics at the same point in time.
You can configure Chart Layout to specify the number of metric trend charts that can be displayed in each row.
You can click Add Instances and Metrics to modify the RDS instances or metrics in the dashboard.
You can click Details in the trend chart of a metric to expand the chart. You can also change the time range to view the changes in the trend of the metric at the specified time range.
You can click Delete in the trend chart of a metric to delete the chart from the dashboard.
Metrics
Category | Metric | Description |
MySQL Server | tps | The transactions per second (TPS). |
qps | The queries per second (QPS). | |
active_session | The number of active sessions. | |
total_session | The total number of sessions. | |
delete_ps | The average number of times that DELETE statements are executed per second. | |
insert_ps | The average number of times that INSERT statements are executed per second. | |
replace_ps | The average number of times that REPLACE statements are executed per second. | |
update_ps | The average number of times that UPDATE statements are executed per second. | |
select_ps | The average number of times that SELECT statements are executed per second. | |
bytes_received | The average number of bytes that are received from all clients per second | |
bytes_sent | The average number of bytes that are sent to all clients per second | |
iops_usage | The IOPS usage. | |
InnoDB storage engine | innodb_bp_hit | The read cache hit ratio of the InnoDB buffer pool. |
innodb_bp_dirty_pct | The ratio of dirty pages in the InnoDB buffer pool. | |
innodb_bp_usage_pct | The utilization of the InnoDB buffer pool. | |
innodb_data_written | The average number of bytes that are written to the InnoDB table per second. | |
innodb_data_read | The average number of bytes that are read from the InnoDB table per second. | |
innodb_rows_deleted | The average number of rows that are deleted from the InnoDB table per second. | |
innodb_rows_read | The average number of rows that are read from the InnoDB table per second. | |
innodb_rows_inserted | The average number of rows that are inserted into the InnoDB table per second. | |
innodb_rows_updated | The average number of rows that are updated in the InnoDB table per second. | |
MySQL processes | cpu_usage | The CPU utilization of MySQL processes. The maximum value of this metric is 100% for ApsaraDB RDS instances. |
mem_usage | The memory usage of the ApsaraDB RDS for MySQL instance in the operating system. | |
iops | The IOPS of the ApsaraDB RDS for MySQL instance. | |
disk_usage | The disk usage. |
You can click the  icon to the right of a metric on a dashboard to view the description of the metric.