Performance Insight is a key tool for performance tuning, load monitoring, and association analysis of your database instances. It helps you visually assess database loads, identify the sources of resource waits and the associated SQL statements, and perform precise performance optimization.
Feature overview
Performance Insight helps you quickly, easily, and directly identify the load on your database instance and the SQL statements that cause performance issues. The main features include the following:
Key performance metric trend charts: Trend charts for memory/CPU utilization, session connections, Transactions Per Second (TPS), and input/output operations per second (IOPS).
Average active sessions (AAS): Tracks the instance load in real time and clearly shows the source of the load.
Multi-dimensional load information: Displays instance load information from dimensions such as SQL, User, Databases, Waits, Hosts, Applications, and Session Type.
Scope
RDS for PostgreSQL meets the following requirements:
Major version: PostgreSQL 13 or later.
Product series: High-availability Edition and Cluster Edition.
Minor engine version: 20240530 or later.
Procedure
Step 1: Enable Performance Insight
Log on to the ApsaraDB RDS console and go to the Instances page. In the top navigation bar, select the region in which the RDS instance resides. Then, find the RDS instance and click the instance ID.
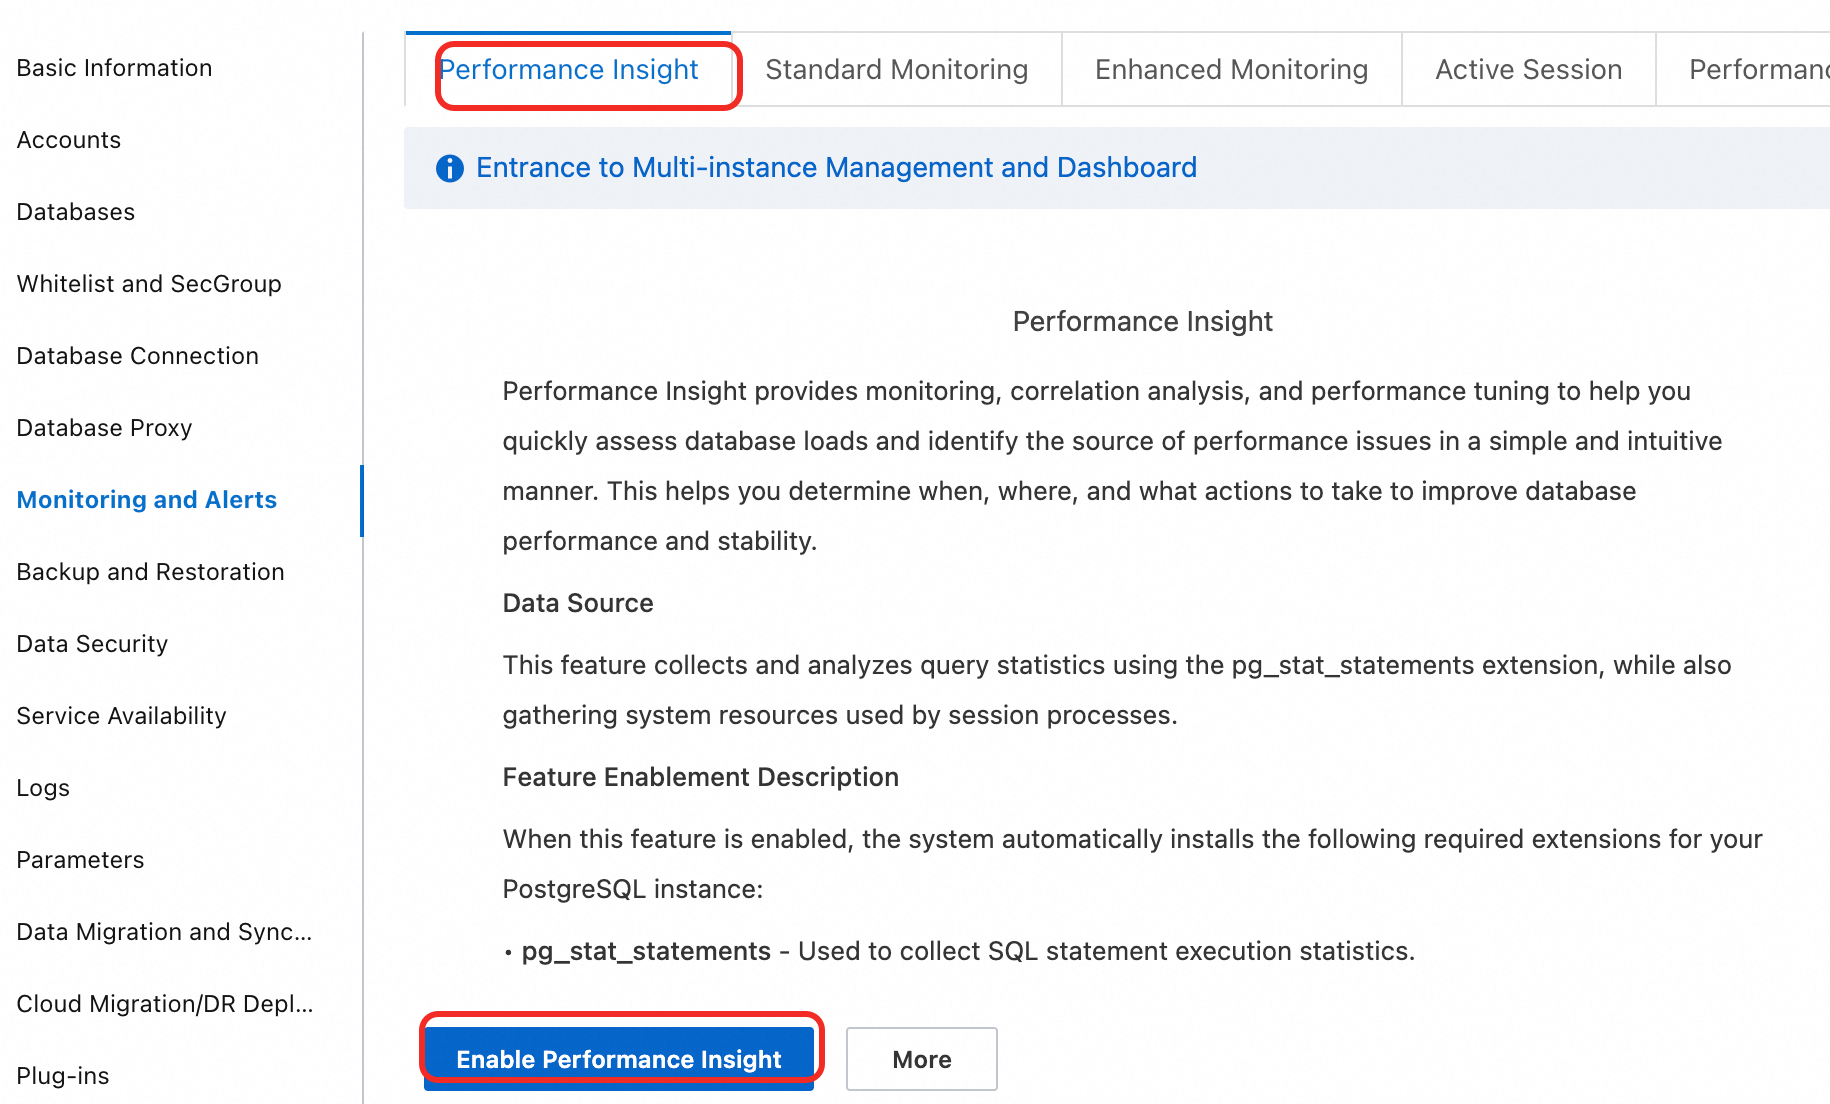
In the navigation pane on the left, choose Monitoring And Alerts. Click the Performance Insight tab.
Click the Enable Performance Insight button. In the dialog box that appears, click OK to enable the feature.
 Note
NoteIf you no longer need the Performance Insight feature, click Performance Insight on the Disable Performance Insight page to disable it.
After you enable the feature, wait for a few moments. Data then starts to appear on the Performance Insight page.
Step 2: Use Performance Insight for analysis
After you enable the feature, you can perform a comprehensive performance analysis on the Performance Insight page.
Performance Insight is in public preview and is free of charge. Data is retained for 7 days. The official release will allow you to extend the data retention period as needed. You will be notified in advance of any charges.
View the performance overview (default view)
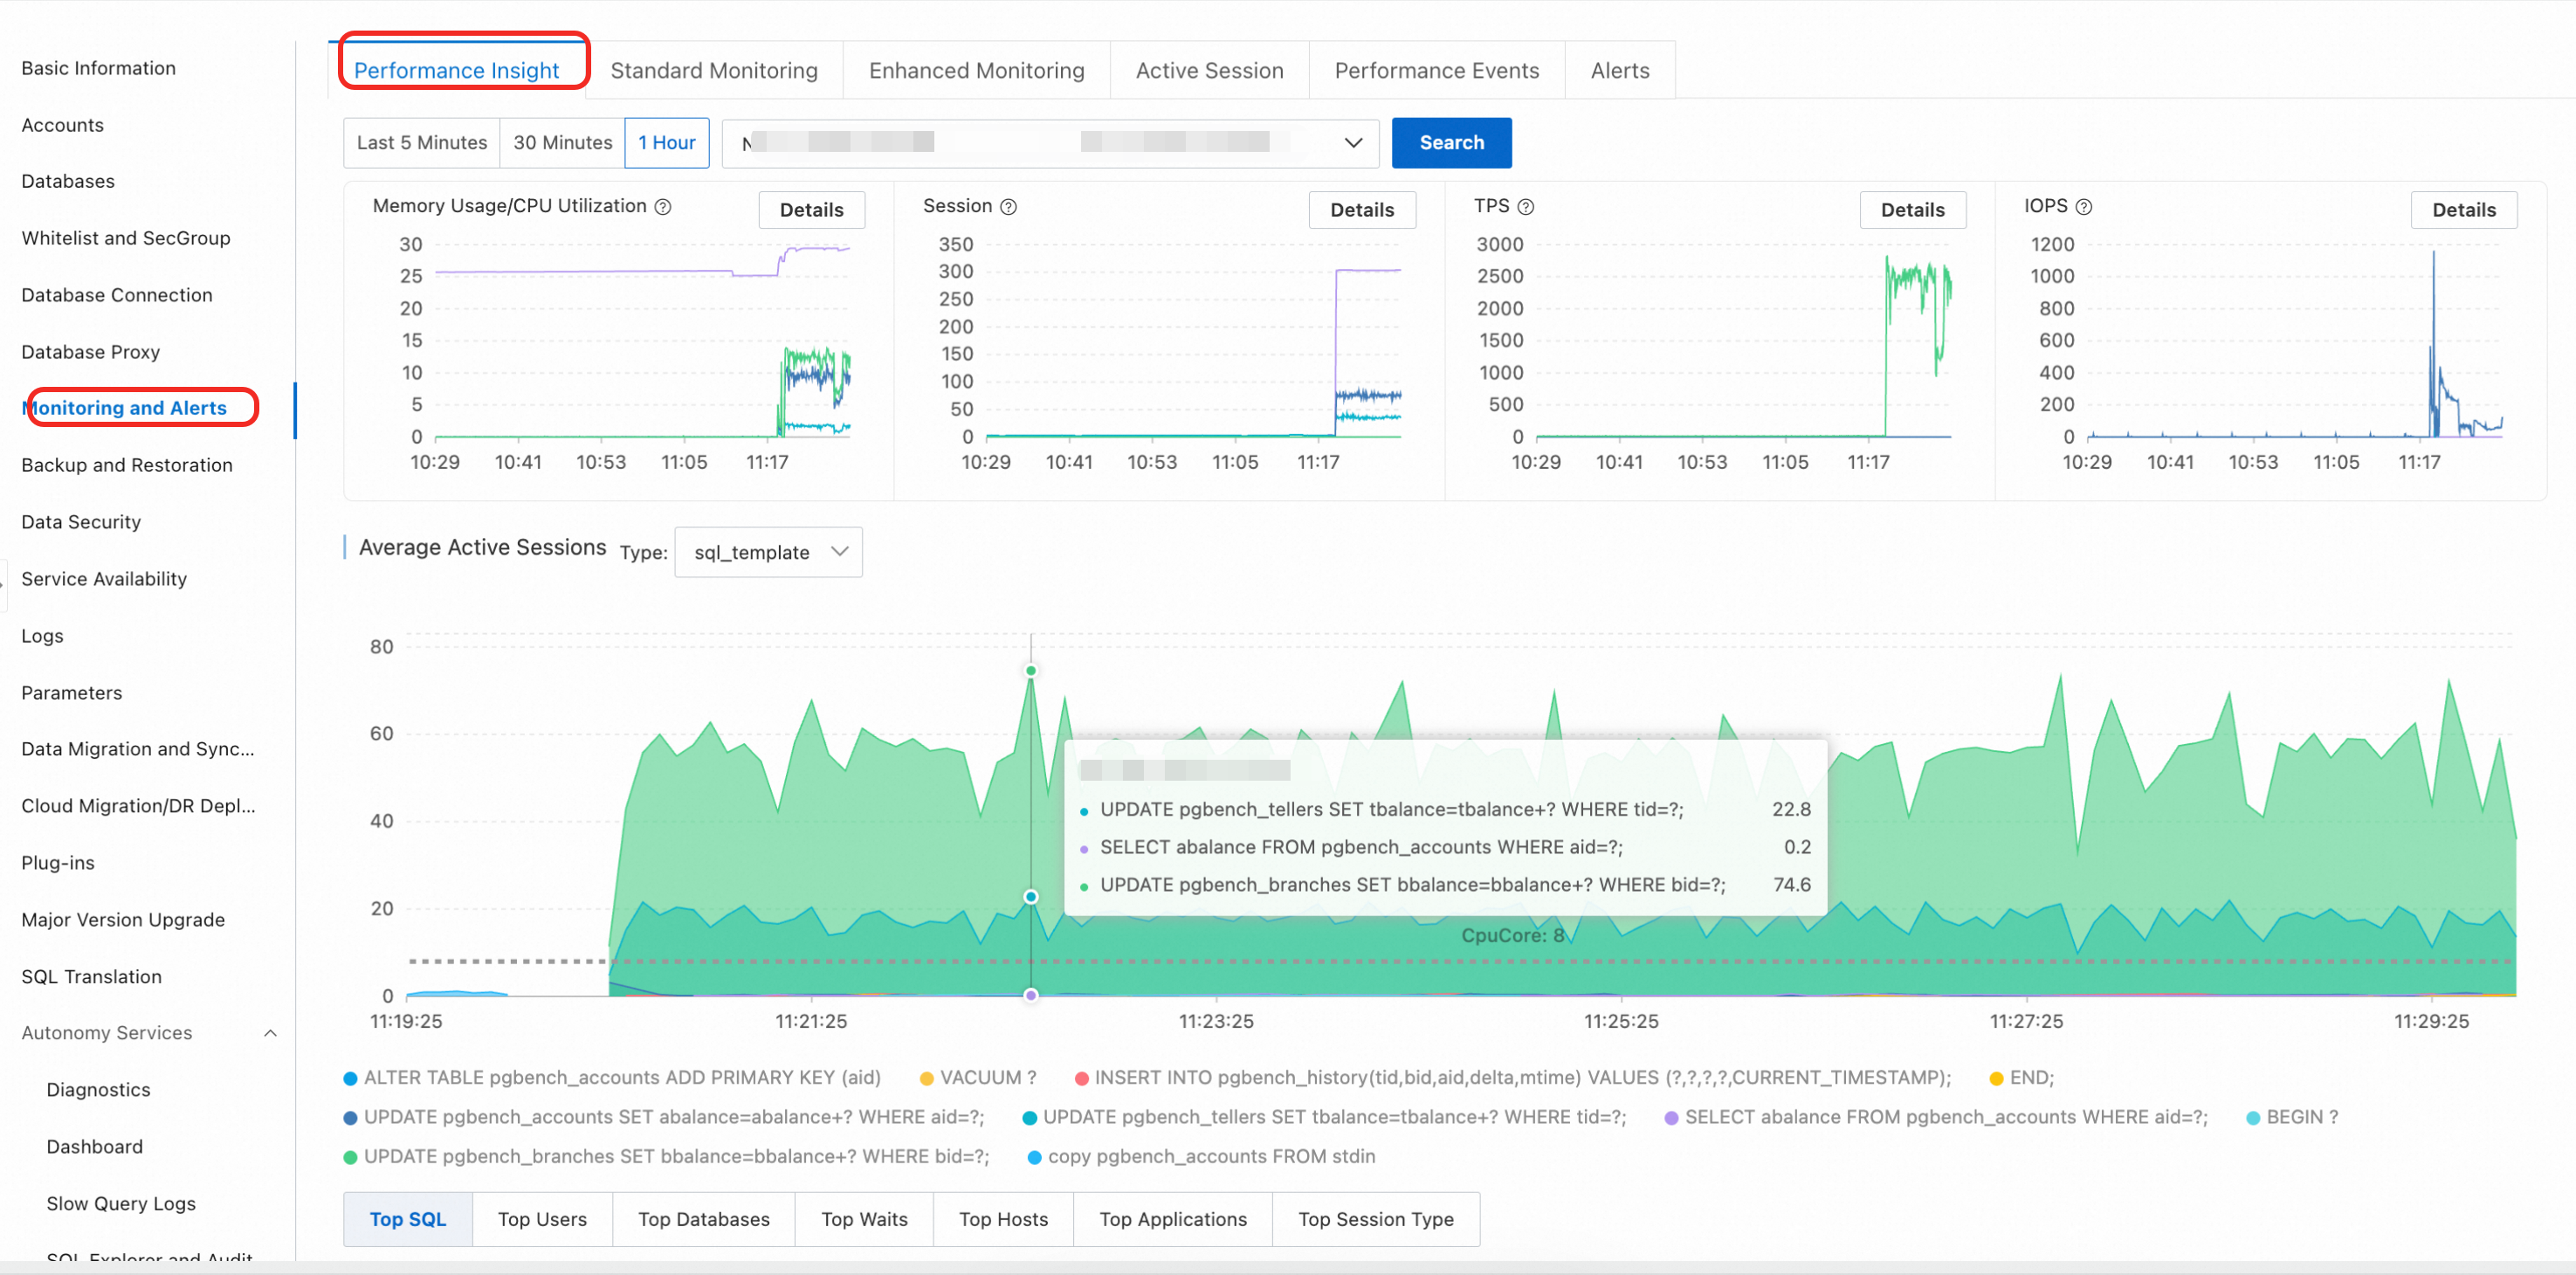
On the Performance Insight page, select a time range, click View, and analyze the following core information:
Key performance metric trend charts: These charts show the trends of core metrics such as CPU/memory, connections, TPS, and IOPS within the selected time range.
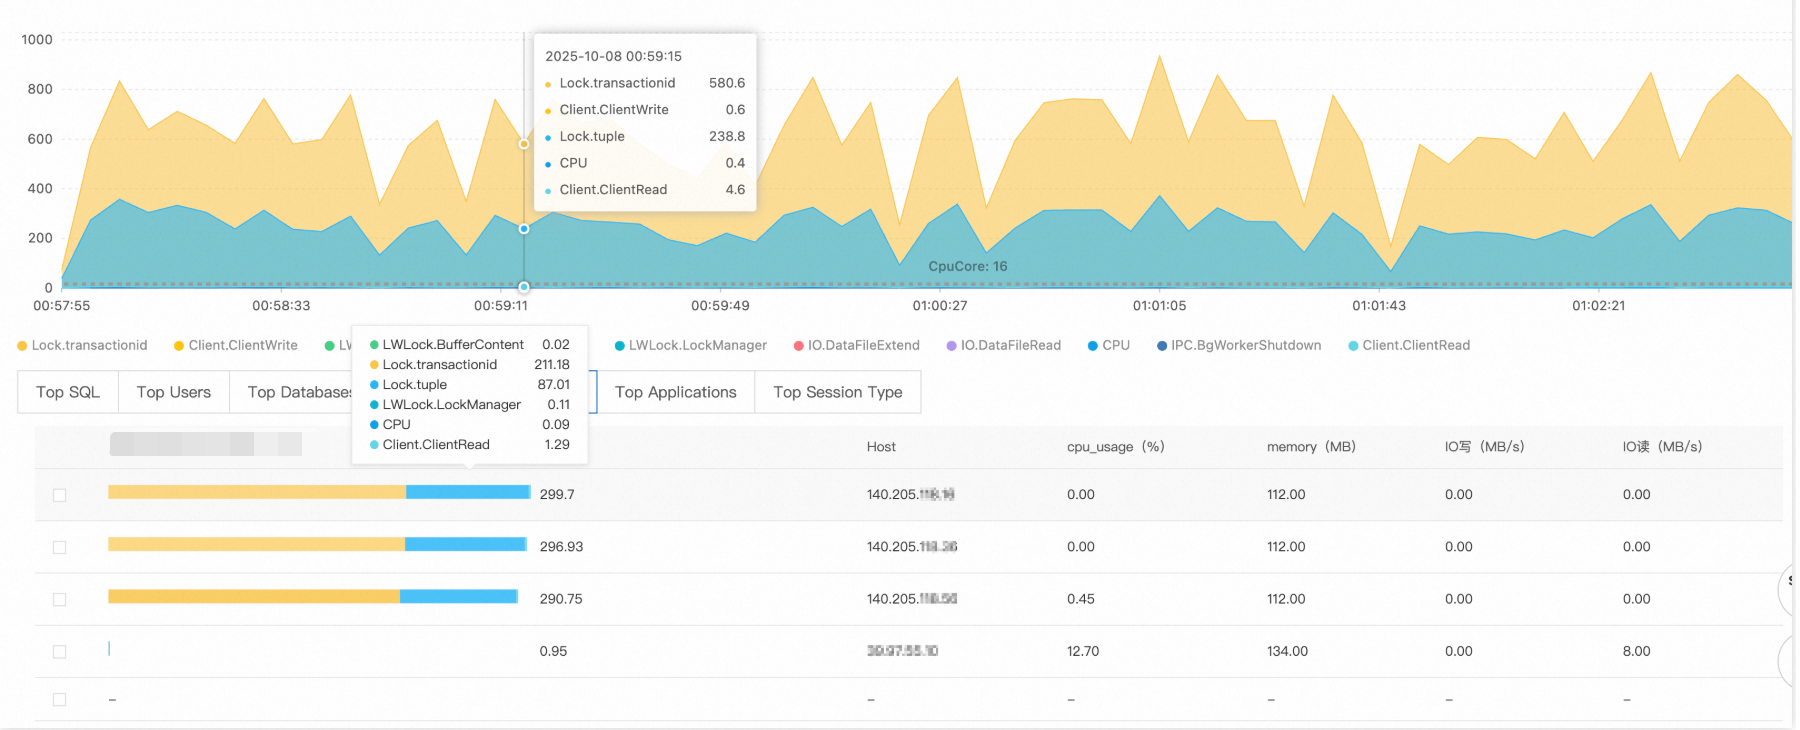
Average active sessions (AAS): This is the core chart for performance diagnostics. It shows the total instance load (the AAS value) and the load composition, broken down by dimensions such as wait events and SQL. Peaks in the AAS chart usually correspond to performance bottlenecks.
Multi-dimensional load information: Below the AAS chart, you can drill down into multiple dimensions such as SQL, User, Databases, and Waits to quickly locate the SQL statements, users, or wait events that are causing a high load.
Troubleshooting case: Lock contention caused by a sudden increase in slow SQL statements
Symptom
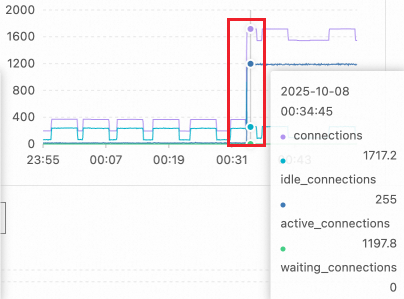
Monitoring data shows that at a certain point, the number of slow SQL statements increased sharply, and the application response time degraded significantly.
Diagnostic analysis
Step 1: Analyze performance metric trends
Check the key performance metric trend chart. The number of active sessions increased sharply from a normal level of about a dozen to over 1,100 at 00:34. This exceeds the reasonable concurrent processing capacity of the PostgreSQL instance.
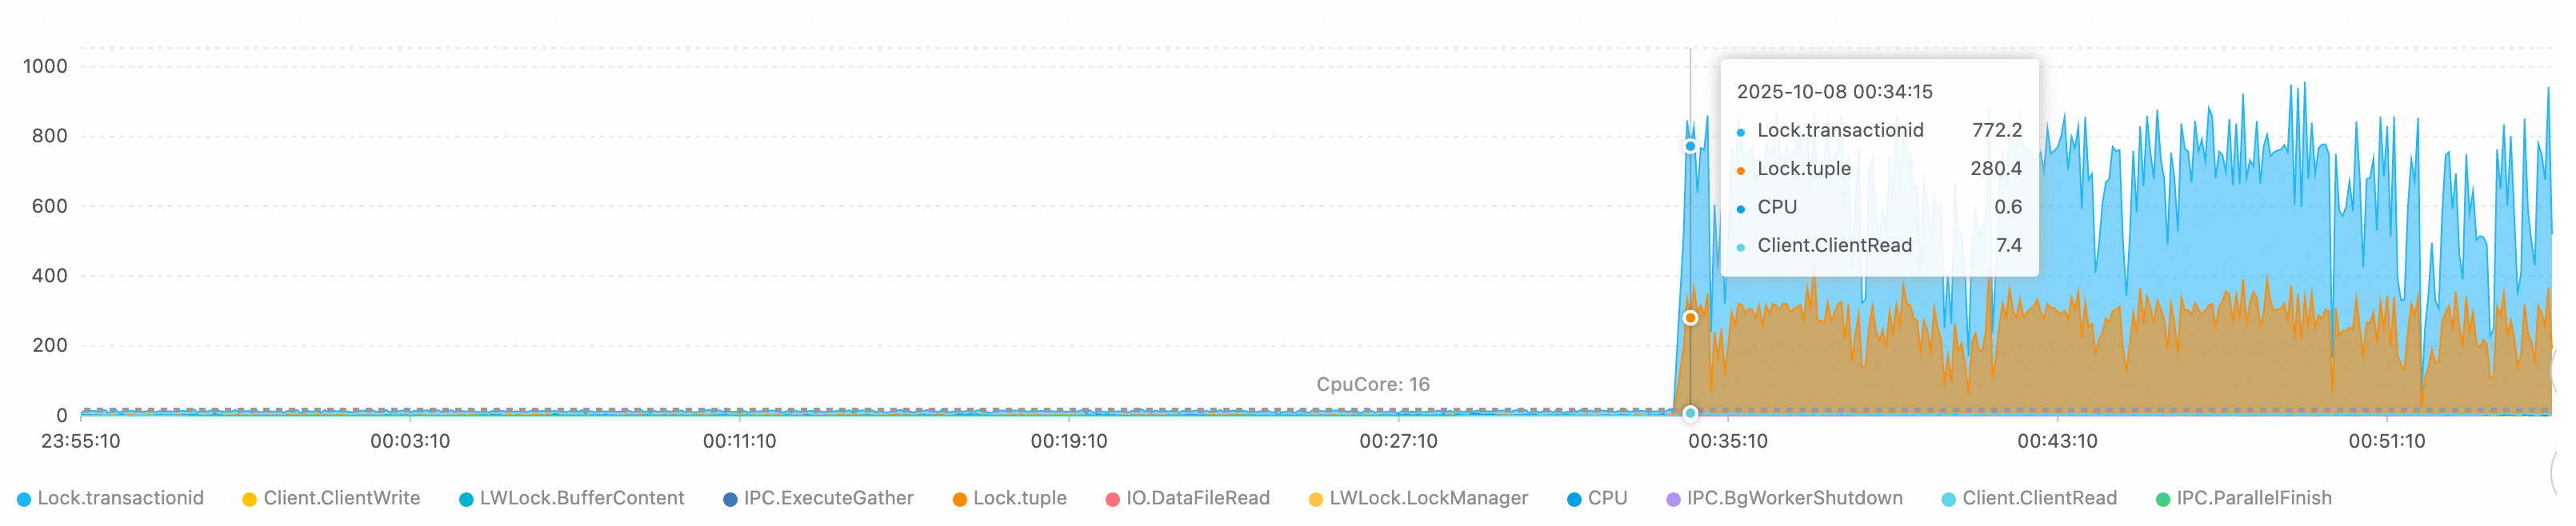
Step 2: Analyze wait events
The wait event distribution in the average active sessions (AAS) chart shows that the main bottlenecks are caused by the following events:
Lock/transactionid: A transaction ID lock wait. This is usually caused by a long-running transaction or a deadlock.Lock/tuple: A row-level lock wait. This indicates severe concurrent write conflicts.
The number of active sessions exceeds the theoretical processing limit of a 16-core CPU. This confirms that the system is experiencing severe lock contention.
Step 3: Analyze SQL statements
The Top SQL list shows that for the top two queries, 220 and 119 sessions are waiting for lock resources to be released. These SQL statements are the source of the lock wait chain.
Step 4: Trace the source
Use the Top Hosts and Top Databases data to identify the source of the problem:
Source client:
140.205.XXX.XXXTarget database:
perf_test
Root cause analysis
Fault type: Lock contention avalanche
Technical principle:
Trigger: The client initiates high-concurrency Data Manipulation Language (DML) operations on the
perf_testdatabase. These operations may involve hot row updates or large-scale transaction processing.Escalation mechanism: In the PostgreSQL lock management mechanism, when multiple transactions compete for the same resource, subsequent transactions enter a waiting queue. Because there are no connection limits or lock wait timeout controls, new connections continuously flood in, creating a vicious cycle of lock waits.
Solutions
Immediate measures:
Limit the number of connections from the problematic client IP address:
ALTER ROLE target_user CONNECTION LIMIT 10; -- target_user: The database usernameTerminate long-waiting sessions:
-- First, view the details of the sessions to be terminated
SELECT
    pid,                                    -- Process ID (session identifier)
    usename,                                -- Database username
    state,                                  -- Session state (such as active or idle)
    wait_event,                             -- Specific type of wait event
    now() - query_start AS query_duration,  -- Duration of the current query
    left(query, 50) AS query_preview        -- Preview of the SQL statement (first 50 characters)
FROM pg_stat_activity
WHERE datname = 'perf_test'                 -- Specify the database name
  AND client_addr = '140.205.XXX.XXX'       -- Specify the client IP address
  AND state = 'active'                      -- Query only active sessions
  AND wait_event_type = 'Lock'              -- Query only sessions that are waiting for locks
  AND pid <> pg_backend_pid()               -- Exclude the current session that is running this query to prevent self-termination
  AND now() - query_start > interval '5 minutes';  -- The query has been running for more than 5 minutes

-- After you confirm the details, terminate the sessions
SELECT pg_terminate_backend(pid)
FROM pg_stat_activity
WHERE datname = 'perf_test'
  AND client_addr = '140.205.XXX.XXX'
  AND state = 'active'
  AND wait_event_type = 'Lock'
  AND pid <> pg_backend_pid()
  AND now() - query_start > interval '5 minutes';

-- Check whether the target sessions are terminated
SELECT pid, usename, state, query
FROM pg_stat_activity
WHERE datname = 'perf_test'
  AND client_addr = '140.205.XXX.XXX';
Long-term optimizations:
Configure a connection pool: Deploy a connection pool such as PgBouncer to control the maximum number of concurrent connections.
Tune timeout parameters:
-- Set the lock wait timeout
ALTER DATABASE perf_test SET lock_timeout = '30s';
-- Set the statement execution timeout
ALTER DATABASE perf_test SET statement_timeout = '60s';
Optimize the application layer:
Reduce transaction granularity to avoid long-running transactions.
Use optimistic locking or distributed lock mechanisms to handle hot spot data.
Implement read/write splitting to divert read-only queries to read-only instances.
Configure monitoring and alerts: Set monitoring thresholds for the number of active connections and lock wait times to receive early warnings about potential faults.
This systematic diagnostic method helps you quickly identify the root cause of PostgreSQL performance issues and develop targeted solutions.