Description
This alert is triggered when the CPU load on a single OBServer of an OceanBase Database tenant exceeds the threshold.
The CPU load of a single OBServer equals the CPU utilization of the OBServer divided by the total CPU utilization of the tenant.
Alert rule
Alert item | Metric type | Metric | Default threshold | Duration (consecutive cycles for triggering an alert) | Detection cycle | Alert level |
Tenant CPU load | Single metric | cpu_usage_percent | 90 | 15 | 1 minute | Warning |
Impact on the system
The overloaded CPU slows down the handling of read and write requests and may even cause services to time out. This issue degrades the service performance of the system.
Possible causes
The application queries a large amount of data or generates hotspot data.
The resource plan of the tenant cannot cope with business requirements or hotspot data is generated.
Solutions
Check whether the load is normal for the application.
Log in to the ApsaraDB for OceanBase console. Click the target instance name on the Instances page to go to the Cluster Instance Workspace page.
Click Tenant Management, and then click the target tenant to go to the Tenant Workspace page.
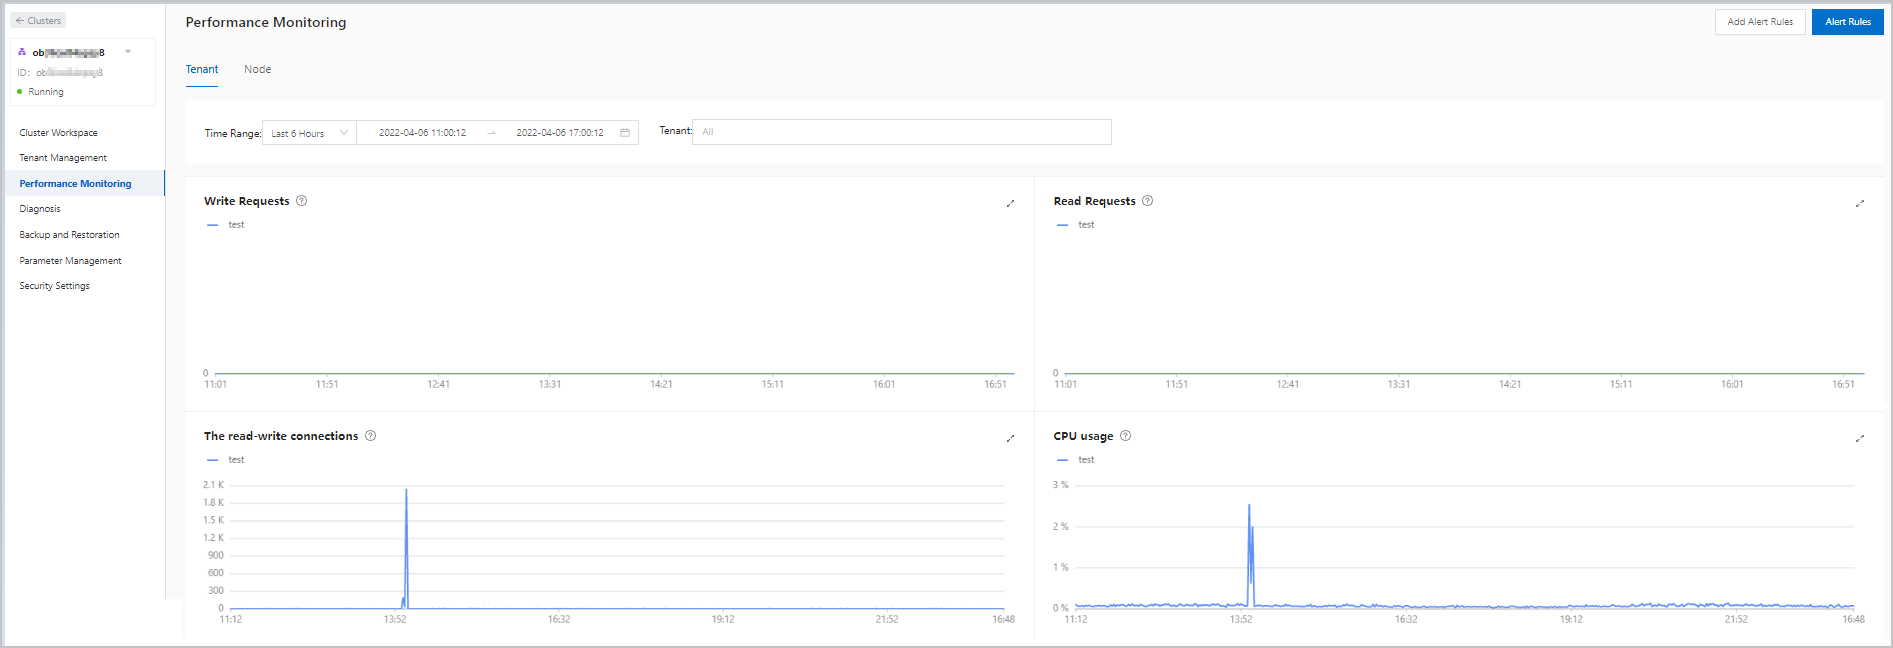
On the Performance Monitoring page of the tenant workspace, view the CPU Utilization curve and check whether the CPU utilization at the alert time was an abrupt increase compared with the CPU utilization in the past one to seven days.
If yes, the CPU load was abnormal.
Otherwise, the high CPU load was caused by normal access traffic. In this case, consider scaling out the tenant.
If the high CPU utilization was caused by querying a large amount of data or hotspot traffic, perform the following steps based on the actual scenarios.
Large SQL queries were executed. In this case, click the TopSQL tab on the Diagnosis page, and then check whether SQL queries with high CPU utilization exist.
If yes, optimize the SQL queries that caused high CPU utilization.
Otherwise, high CPU utilization was not caused by large SQL queries.
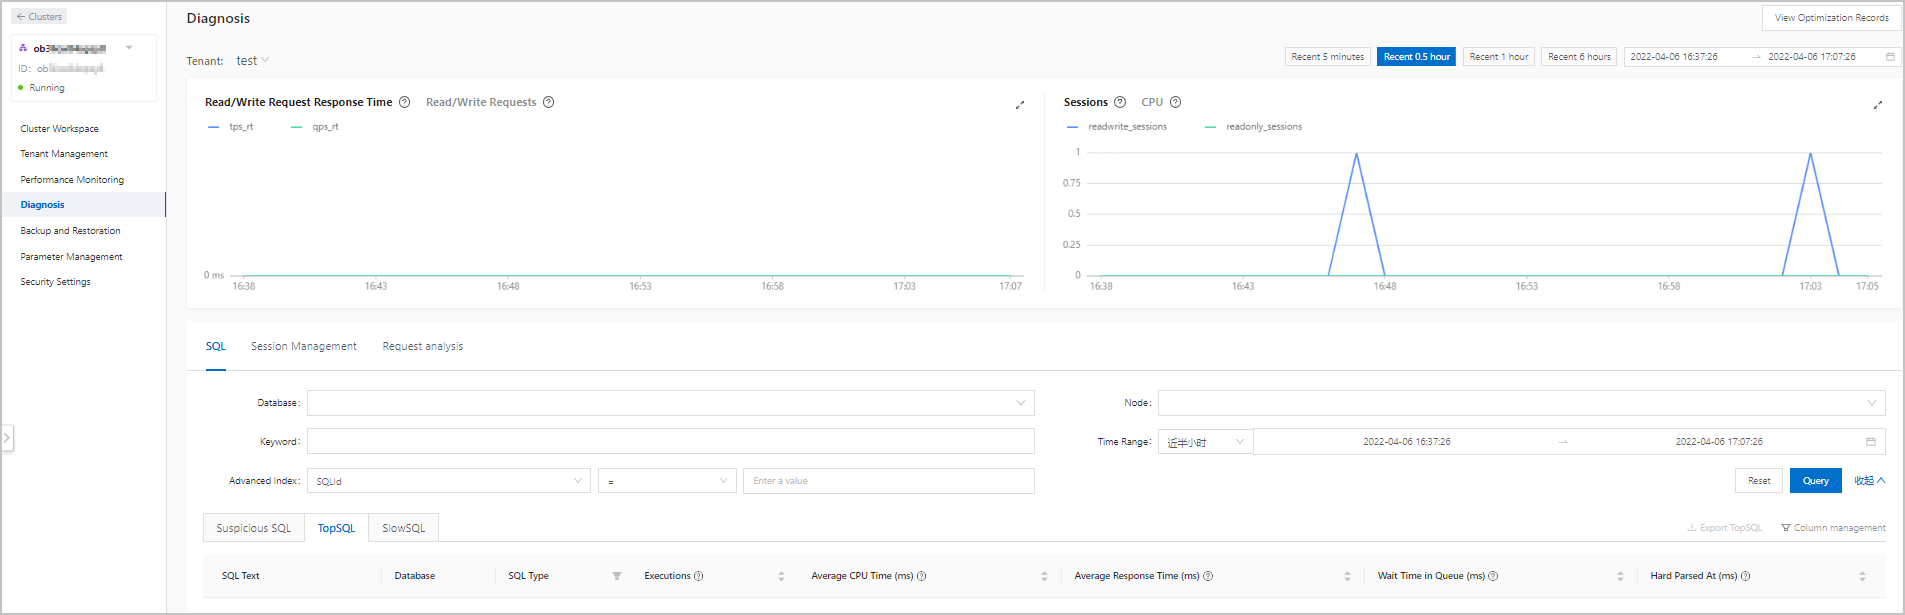
The high CPU utilization was caused by slow SQL queries. In this case, click the SlowSQL tab on the Diagnosis page, and then check the diagnosis result for slow SQL queries. Optimize the slow SQL queries that you found.
Enable throttling on the Diagnosis page for problematic SQL statements.