The Dedicated Cluster Profile page provides a visual overview of resource usage, workload distribution, and health status across your dedicated cluster and its hosts. Use it to spot resource bottlenecks, review optimization suggestions, and drill down into individual host metrics from a single page.
Dedicated cluster profiles are supported only for ApsaraDB MyBase for MySQL and ApsaraDB MyBase for SQL Server.
View the cluster profile
-
Log on to the ApsaraDB for MyBase console.
-
In the upper-left corner of the page, select a region.
-
In the left-side navigation pane, click Dedicated Cluster Profile. From the drop-down list in the upper-left corner, select the dedicated cluster you want to inspect. The cluster profile is organized into the following sections:
No. Section Description ① Dedicated Cluster Overview Shows the total number of hosts and instances, and the percentages of CPU cores, memory, and storage capacity in use. ② Scaling Settings Shows the overcommit ratios for CPU, memory, and storage, and provides a link to configure scaling policies. For more information, see Configure an auto scaling policy for CPU resources. ③ Host Resource Distribution Shows the distribution of host specifications and workloads. Click Resource Optimization Suggestions to view resource optimization recommendations. ④ Instance Resource Distribution Shows the distribution of instance specifications and workloads. ⑤ Hosts Shows the health status and details of each host, with links to manage hosts. Sort hosts using Sort by Zone or Sort by Health Status. Switch between Simple Mode and Detailed Mode to control the level of detail. 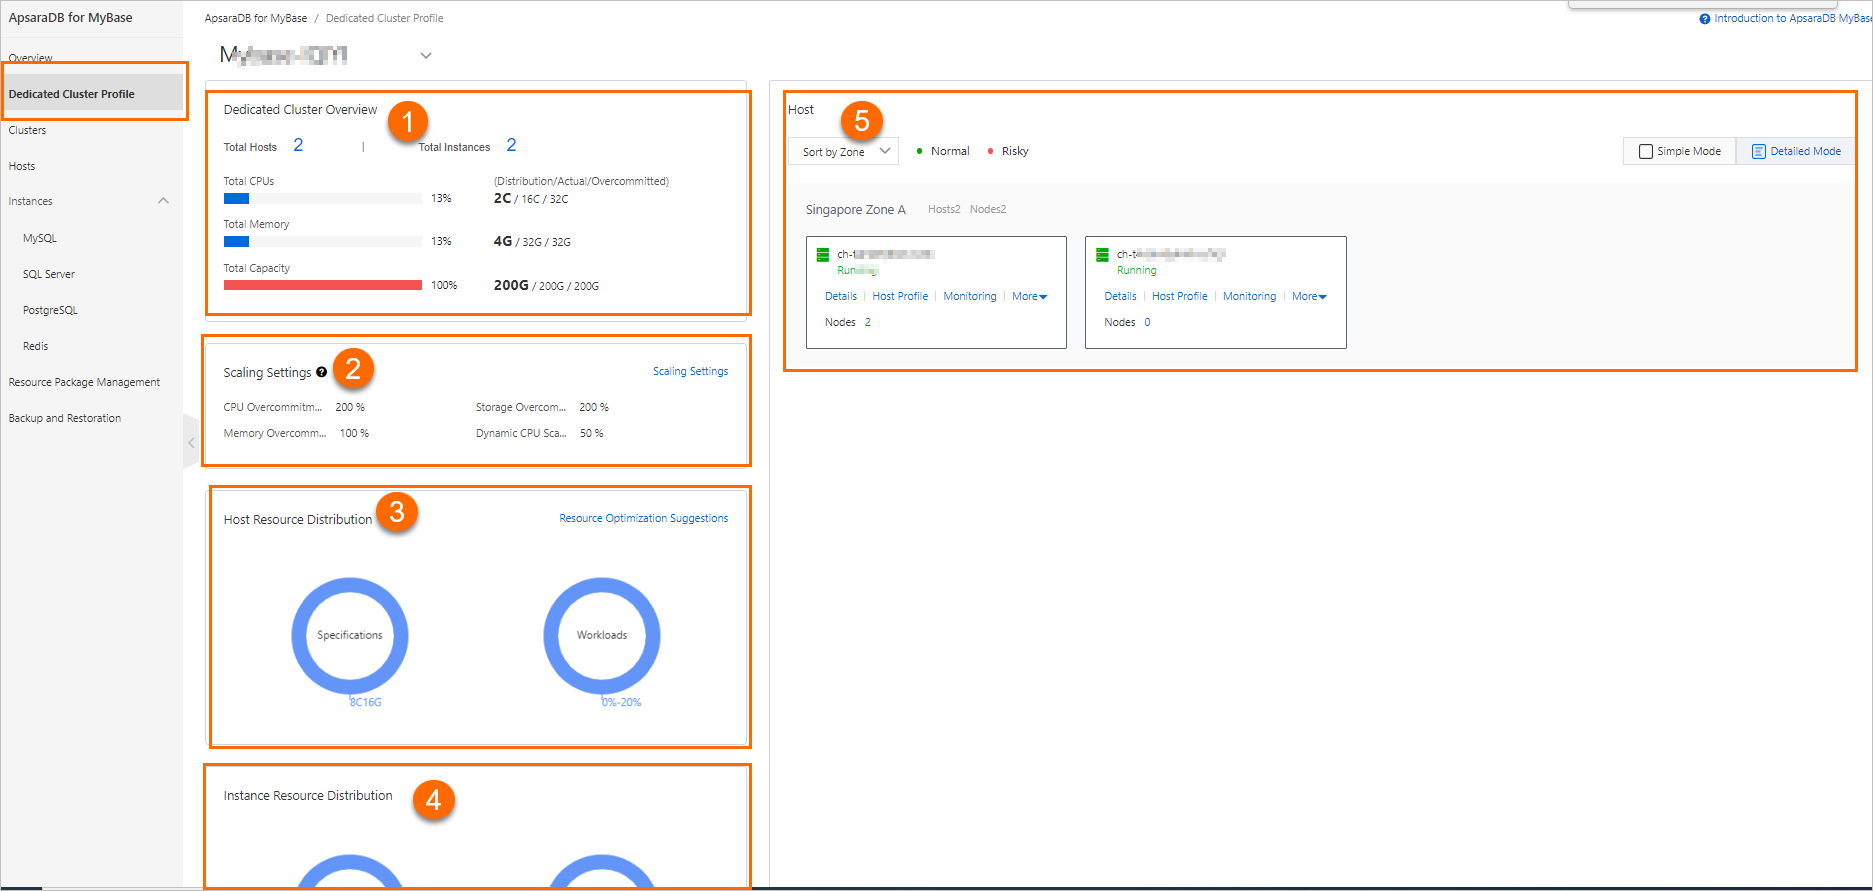
-
In the Hosts section, find the host you want to inspect and click Host Profile. The host profile is organized into the following sections:
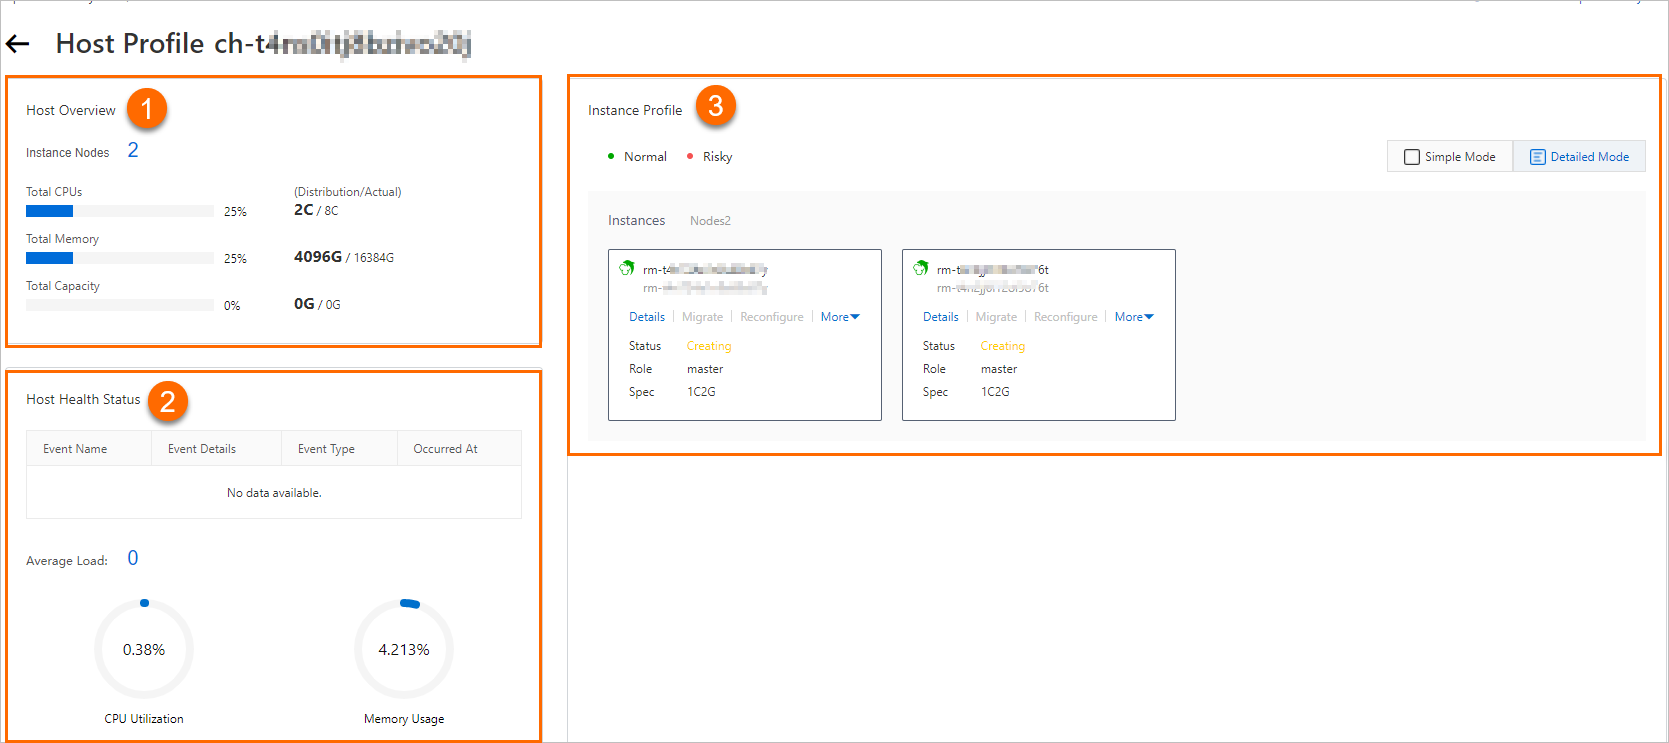
No. Section Description ① Host Overview Shows the number of instances and the percentages of CPU cores, memory, and storage capacity in use on the host. ② Host Health Status Shows exception events, health status, and CPU utilization for the host. ③ Instance Profile Shows the health status and details of each instance, with links to manage instances. Switch between Simple Mode and Detailed Mode to control the level of detail. 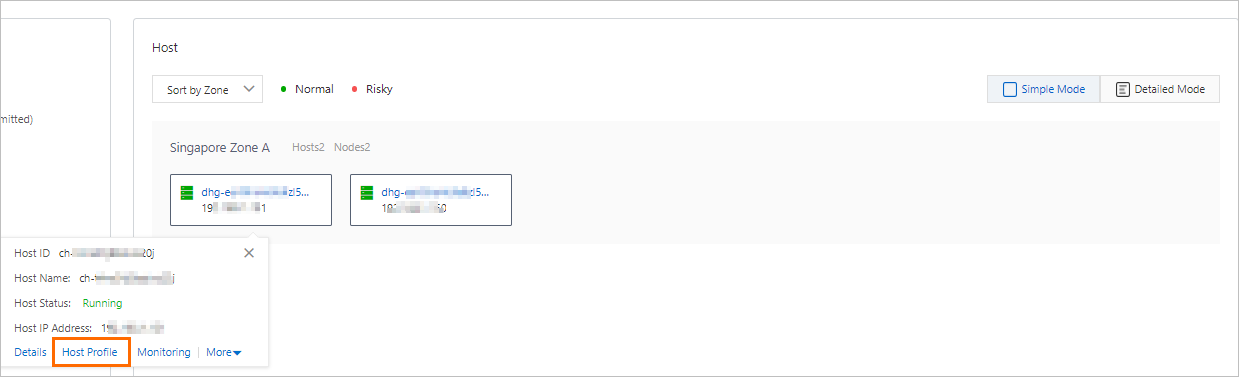
View the 3D cluster profile
The 3D cluster profile provides an interactive, three-dimensional view of your dedicated cluster. Hover over hosts and instances to inspect resource usage, right-click to perform management actions, or click to open dedicated dashboards.
3D dedicated cluster profiles are supported only for ApsaraDB MyBase for MySQL and ApsaraDB MyBase for SQL Server.
-
Log on to the ApsaraDB for MyBase console.
-
In the upper-left corner of the page, select a region.
-
In the left-side navigation pane, click Dedicated Cluster Profile. From the drop-down list in the upper-left corner, select a dedicated cluster, then click Experience 3D cluster portrait. The 3D profile is organized into the following sections:
-
Example of a 3D dedicated cluster profile:
-
Overview of a 3D dedicated cluster profile:
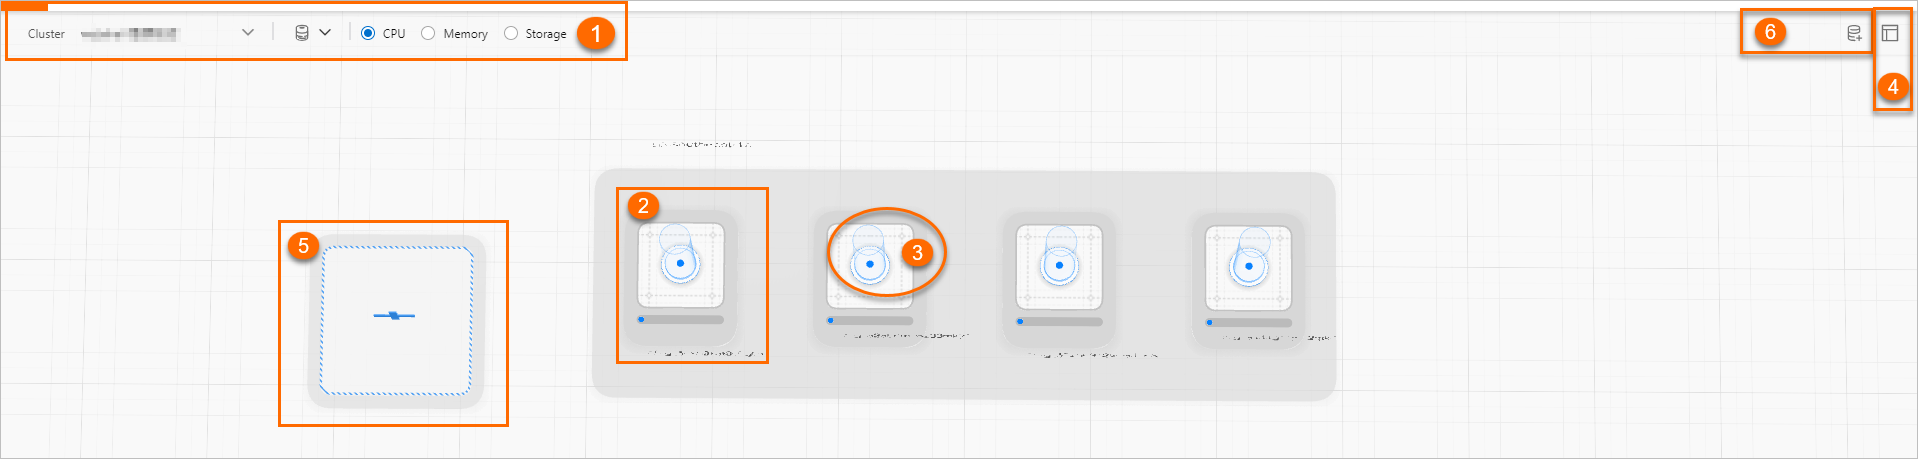
No. Section Description ① Filter conditions Filter hosts and instances by dedicated cluster and risk level. The panel shows total and in-use values for memory, storage capacity, and CPU cores. Risk levels are defined as follows: CPU utilization: < 35% (low), 35%–80% (medium), > 80% (high). Memory usage: < 80% (low), 80%–90% (medium), > 90% (high). Storage usage: < 80% (low), 80%–90% (medium), > 90% (high). ② Host Hover: View basic host information and total/in-use values for memory, storage capacity, and CPU cores. Right-click: Restart, renew, or upgrade the host from the shortcut menu. Click: Open the Host Dashboard panel to view a resource usage overview, log on to the host, or renew it. ③ Instance Hover: View basic instance information and total/in-use values for memory, storage capacity, and CPU cores. Right-click: Migrate, modify the configuration, restore a backup to a new instance, create a read-only instance, or release the instance. Click: Open the Instance Dashboard panel to view a resource usage overview, migrate, or release the instance. You can also view the primary/secondary relationship between instances. ④ Cluster Information Click the  icon to open the Cluster Dashboard panel. From there, review the cluster resource overview and host/instance allocation ratios, create a host or instance, or update overcommit ratios by clicking the
  icon in the Scaling Settings section and specifying CPU Overcommit Ratio, Memory Overcommit Ratio, and Storage Overcommit Ratio.
⑤ Create Host Click the Create Host section to create a host in the dedicated cluster. For more information, see Create a host. ⑥ Create Instance Click the Create Instance section to create an instance. For more information, see Create an ApsaraDB MyBase for MySQL instance. -
What's next
-
To adjust the overcommit ratios based on the resource distribution data you reviewed, see Configure an auto scaling policy for CPU resources.
-
To add capacity to your cluster, see Create a host and Create an ApsaraDB MyBase for MySQL instance.