ApsaraDB for Cassandra uses CloudMonitor for monitoring and alerting. For more information, see the official CloudMonitor documentation.
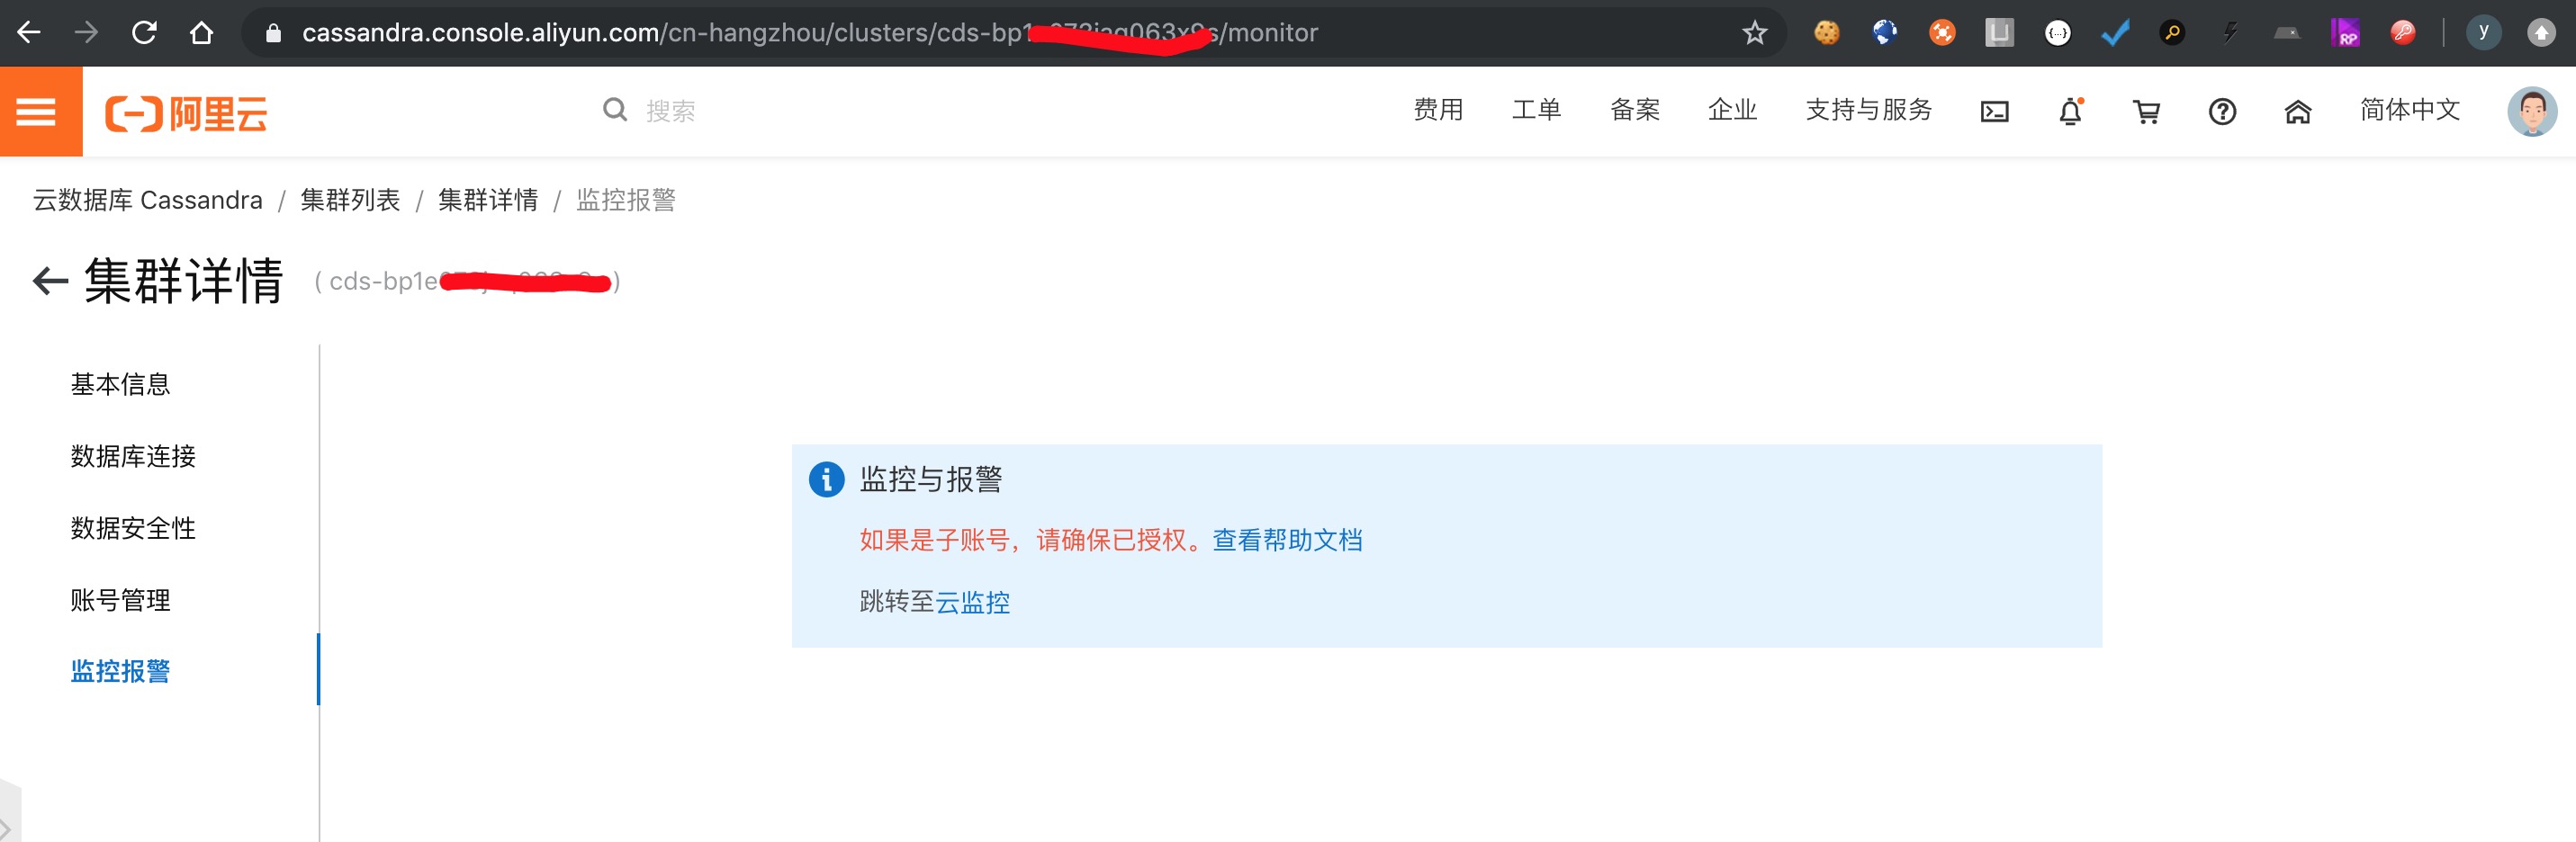
Authorize access to cloud resources
When you first access CloudMonitor from ApsaraDB for Cassandra, you must authorize access to your cloud resources. ApsaraDB for Cassandra requires this authorization to create a Cassandra group in CloudMonitor and add the current cluster instance to it.
Note: An Alibaba Cloud account typically grants this authorization.
Grant permissions to a RAM user
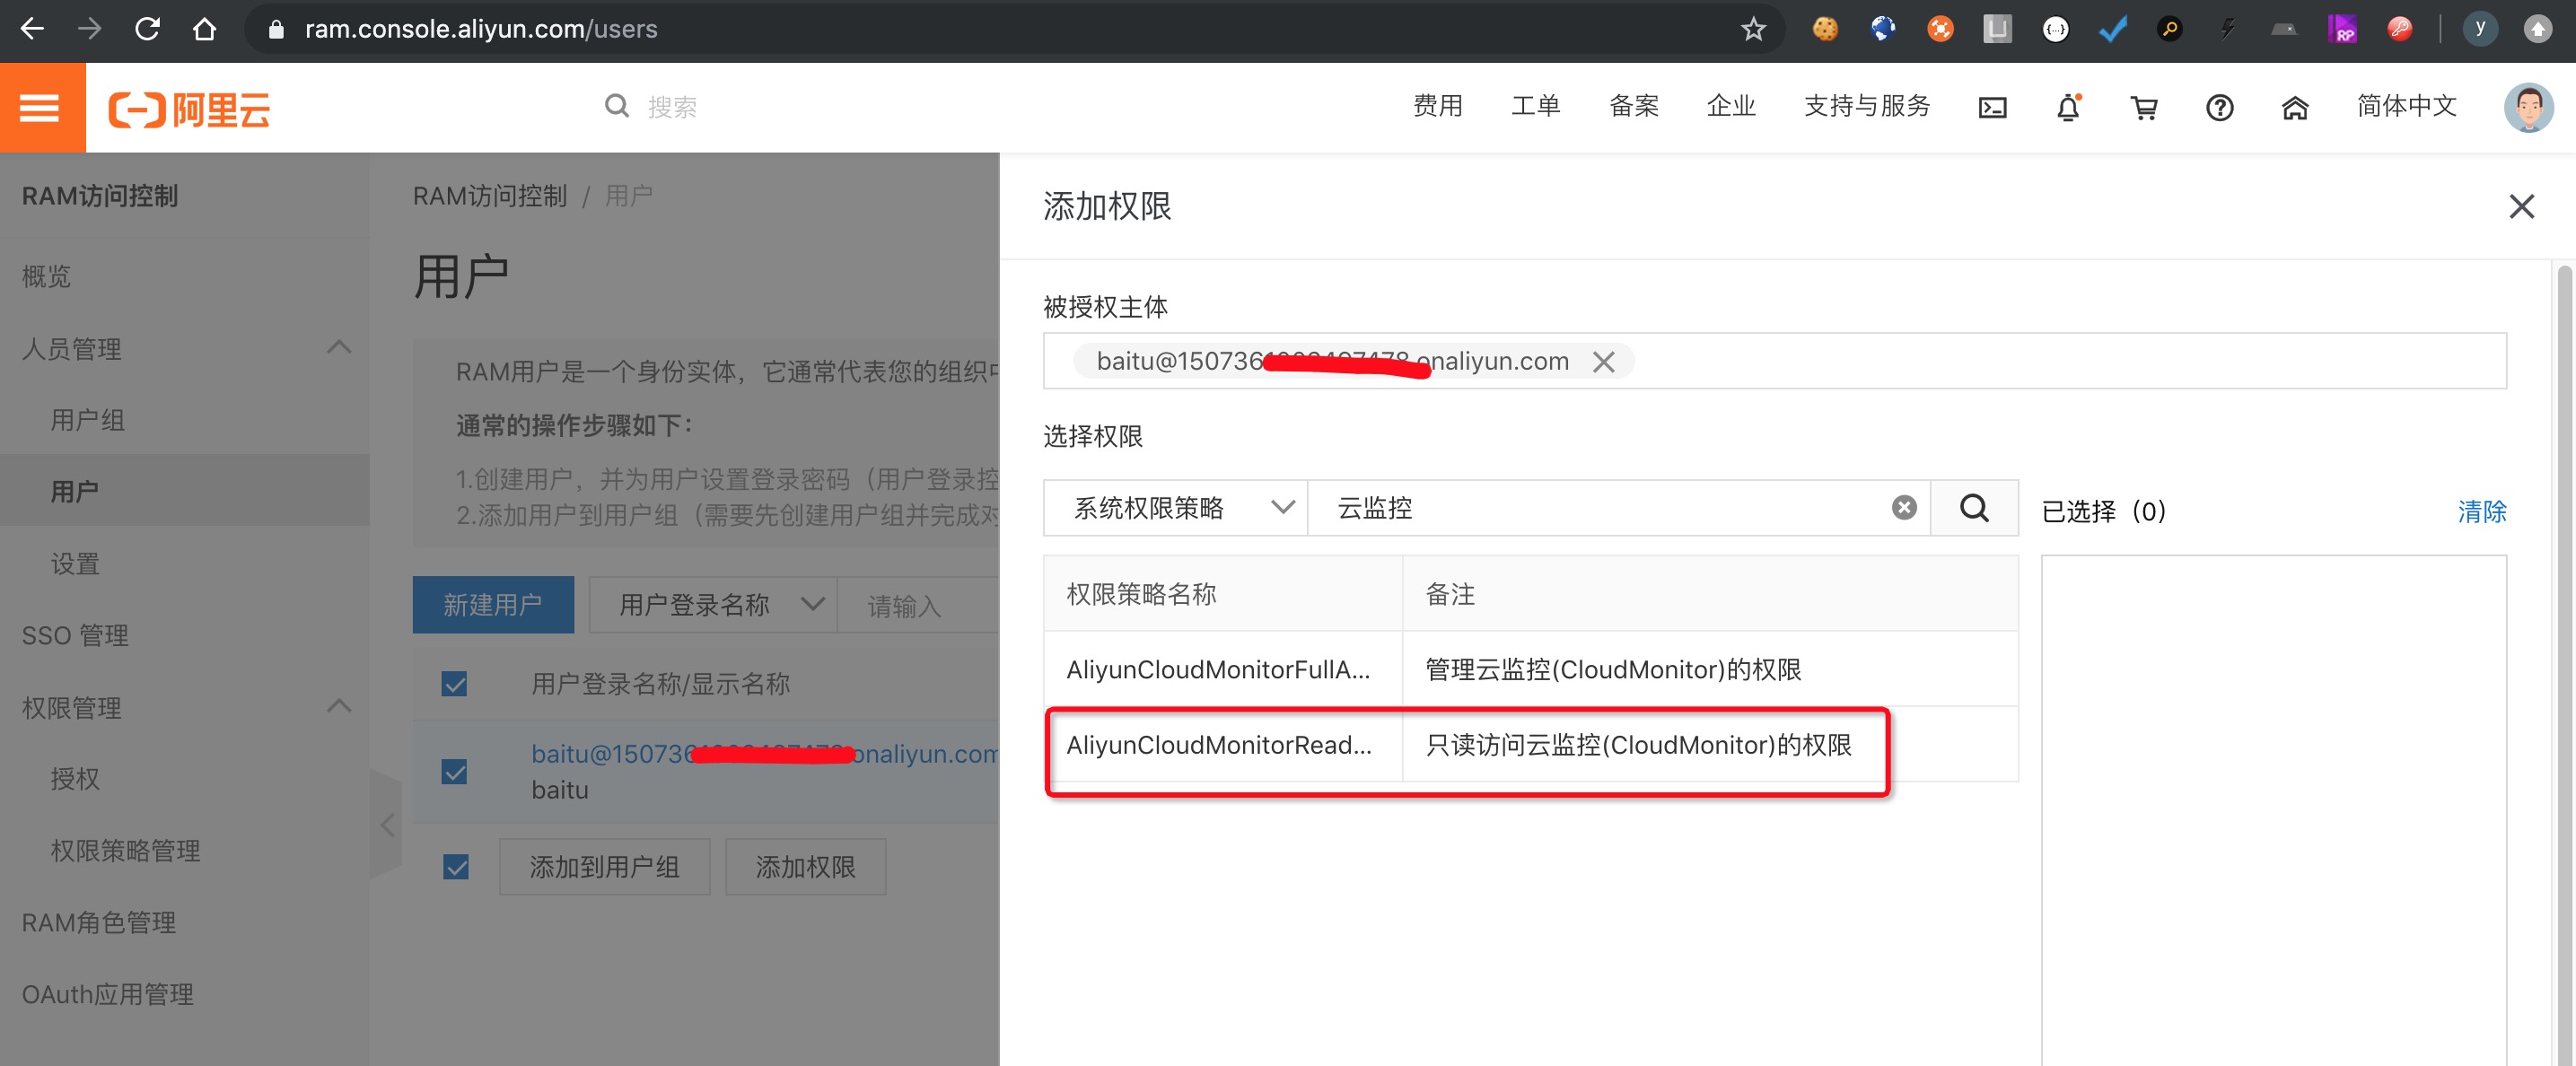
If you use a RAM user, you must first grant it the following permission policy.
CloudMonitor permissions
CloudMonitor dashboard
After you grant the required permissions, you are redirected to the CloudMonitor dashboard.
At the top of the CloudMonitor dashboard, you can select the product (for example, ApsaraDB for Cassandra), cluster region, and resource type (cluster monitoring), and filter data by a time range from 1 hour to 14 days. The main body of the page contains CPU and memory monitoring sections. The CPU section includes line charts for metrics such as CPU utilization (%), CPU wait (%), and CPU load (1/5/15 minute). The memory section includes line charts for heap memory utilization (%), non-heap memory (bytes), and memory utilization (%). Each chart displays monitoring curves for individual nodes, such as dc1-3, dc1-4, and dc1-5. In the upper-right corner are the alert rule and refresh buttons.