NGINX is a free, open source, and high-performance server that serves as an HTTP server and a reverse proxy. You can perform tracing analysis on NGINX to better monitor the status of your applications. This topic describes how to perform tracing analysis on NGINX.
Prerequisites
Log on to the Managed Service for OpenTelemetry console.
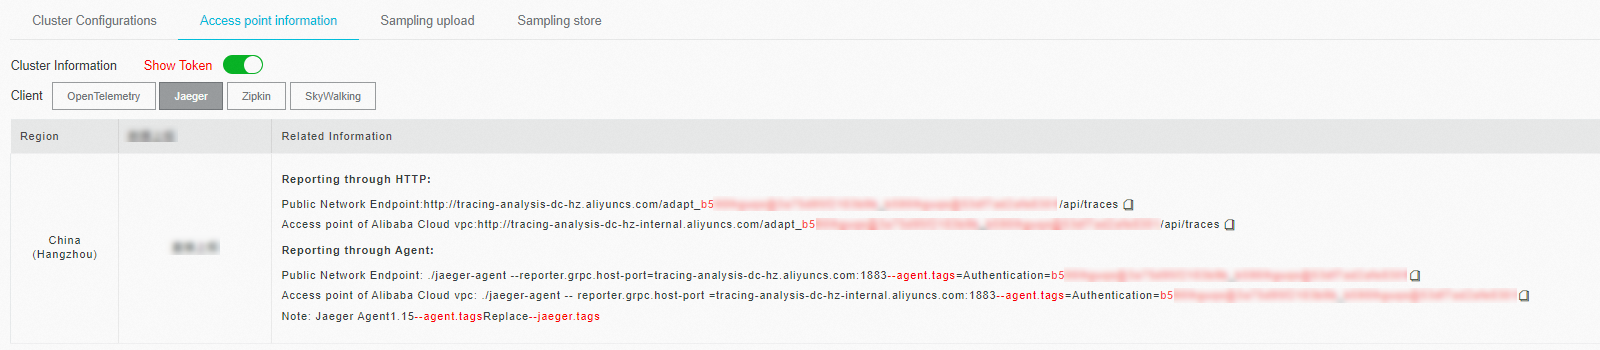
In the left-side navigation pane, click Cluster Configurations. Then, click the Access point information tab.
In the top navigation bar, select a region. In the Cluster Information section, turn on Show Token.
In the Client section, click Jaeger or Zipkin.
Obtain an endpoint of Jaeger or Zipkin in the Related Information column of the table in the lower part.
 Note
NoteIf your application is deployed in an Alibaba Cloud production environment, use a VPC endpoint. Otherwise, use a public endpoint. Generally, use the endpoint of v2 for Zipkin. Use the endpoint of v1 only if you know Zipkin well.
Overview
If a slow response occurs in a microservice that uses NGINX as a proxy, you cannot estimate the impact of the slow response because no data is collected. In this case, you can use Tracing Analysis to trace NGINX requests for the microservice and calculate the number of page views that are affected by the slow response.
Deploy and trace NGINX in a Docker container
Download, build, and then deploy a Dockerfile:
wget https://arms-apm.oss-cn-hangzhou.aliyuncs.com/demo/nginx-zipkin-docker.tgz
tar -xzvf nginx-zipkin-docker.tgz
cd nginx-zipkin
# Build the Dockerfile.
docker build --rm --tag nginx-zipkin:0.1
Run Docker:
docker run --rm -p 80:80 -e "COLLECTOR_HOST=${ZIPKIN_ENDPOINT}?" -d nginx-zipkin:0.1Set the
${ZIPKIN_ENDPOINT}variable to the version 1 endpoint of Zipkin that you copy in Prerequisites, but remove "http://" and suffix the value with a question mark (?).Example:
docker run --rm -p 80:80 -e "COLLECTOR_HOST=tracing-analysis-dc-hz.aliyuncs.com/adapt_123@abc_456@efg/api/v1/spans?" -d nginx-zipkin:0.1
Deploy and trace NGINX on an ECS instance
Install NGINX.
Download and decompress the NGINX source code:
wget http://nginx.org/download/nginx-1.14.2.tar.gz
tar -xzvf nginx-1.14.2.tar.gz
Compile the NGINX source code:
cd nginx-1.14.2
./configure --with-compat
make
sudo make install
Install OpenTracing.
Download and decompress the OpenTracing package:
wget https://github.com/opentracing-contrib/nginx-opentracing/releases/download/v0.7.0/linux-amd64-nginx-1.14.0-ngx_http_module.so.tgz
tar -xzvf linux-amd64-nginx-1.14.0-ngx_http_module.so.tgz
Copy the .so file to the modules folder of NGINX. If the folder does not exist, create the folder:
sudo mkdir /usr/local/nginx/modules
sudo cp ngx_http_opentracing_module.so /usr/local/nginx/modules/ngx_http_opentracing_module.so
Use Zipkin to perform tracing analysis.
Download Zipkin to a working directory:
wget  https://github.com/rnburn/zipkin-cpp-opentracing/releases/download/v0.5.2/linux-amd64-libzipkin_opentracing_plugin.so.gz
gunzip linux-amd64-libzipkin_opentracing_plugin.so.gz
sudo cp linux-amd64-libzipkin_opentracing_plugin.so /usr/local/lib/libzipkin_opentracing_plugin.so
Configure the /usr/local/nginx/conf/nginx.conf file:
load_module modules/ngx_http_opentracing_module.so; events {} http { opentracing on; opentracing_load_tracer /usr/local/lib/libzipkin_opentracing.so /etc/zipkin-config.json; server { error_log /var/log/nginx/debug.log debug; listen 80; location ~ { opentracing_operation_name $uri; opentracing_trace_locations off; # The service that you use to navigate to the proxy. Set the value based on your business requirements. proxy_pass http://127.0.0.1:8081; opentracing_propagate_context; } } }NoteFor information about the parameters, see opentracing-contrib.
Set the Zipkin parameters in the /etc/zipkin-config.json file:
{
  "service_name": "nginx",
  "collector_host": "zipkin"
}
If you use the Zipkin service that is managed by Alibaba Cloud, set the collector_host parameter to an endpoint of Zipkin.
NoteEnter the version 1 endpoint of Zipkin that you copy in Prerequisites, but remove "http://" and suffix the value with a question mark (?).
"collector_host": "tracing-analysis-dc-hz.aliyuncs.com/adapt_abc123@abc456_abc123@abc356/api/v1/spans?"Set the sample_rate parameter to specify the sampling ratio:
// Set the sampling ratio to 10%.
"sample_rate":0.1
Run NGINX and access the NGINX service:
sudo /usr/local/nginx/sbin/nginx
curl "http://localhost"
Deploy and trace NGINX on other environments
Pull an image from Container Registry:
sudo docker pull registry.cn-hangzhou.aliyuncs.com/public-community/nginx-zipkin:0.1Run NGINX in a Docker container:
docker run --rm -p 80:80 -e "COLLECTOR_HOST=${ZIPKIN_ENDPOINT}?" -d registry.cn-hangzhou.aliyuncs.com/public-community/nginx-zipkin:0.1Set the
${ZIPKIN_ENDPOINT}variable to the version 1 endpoint of Zipkin that you copy in Prerequisites, but remove "http://" and suffix the value with a question mark (?).Example:
docker run --rm -p 80:80 -e "COLLECTOR_HOST=tracing-analysis-dc-hz.aliyuncs.com/adapt_******_******/api/v1/spans?" -d registry.cn-hangzhou.aliyuncs.com/public-community/nginx-zipkin:0.1Go to the NGINX page by using a browser.
Enter localhost/nginx.conf or curl "localhost/nginx.conf" in the address bar of a browser to go to the NGINX page.
Check the result
Log on to the ARMS console. In the left-side navigation pane, choose . On the Applications page, click the name of the application. On the page that appears, view the trace data.
If the  icon is displayed in the Language column, the application is connected to Application Monitoring. If a hyphen (-) is displayed, the application is connected to Managed Service for OpenTelemetry.