Thread pools and connection pools that are misconfigured or exhausted cause request timeouts, connection leaks, and cascading failures. Thread pool and connection pool monitoring in Application Real-Time Monitoring Service (ARMS) collects real-time metrics from your Java applications so you can:
Detect thread pool saturation before it causes request timeouts
Identify connection leaks by tracking active-to-idle connection ratios
Right-size pool configurations based on actual utilization data
ARMS collects metrics from popular frameworks including Tomcat, Dubbo, Jetty, Undertow, HikariCP, Druid, and more.
Only Application Monitoring Pro Edition supports this feature.
Before you begin
Make sure that your application is monitored by ARMS. For more information, see Overview.
Version compatibility
| ARMS agent version | Thread pool and connection pool monitoring | Action required |
|---|---|---|
| V2.7.3.5 and later | Enabled by default | None |
| V2.7.1.3 to V2.7.3.4 | Supported, requires manual enablement | See Enable monitoring manually |
| Earlier than V2.7.1.3 | Not supported | Update the ARMS agent to V2.7.1.3 or later |
Enable monitoring manually
If your ARMS agent version is V2.7.3.5 or later, monitoring is already enabled. Skip this section.
For ARMS agent V2.7.1.3 to V2.7.3.4:
Log on to the ARMS console. In the left-side navigation pane, choose Application Monitoring > Application List.
On the Application List page, select a region in the top navigation bar and click the name of the application.
Icons in the Language column indicate the programming language: -
 : Java -
  : Go -
  : Python - - (Hyphen): an application monitored in Managed Service for OpenTelemetry
In the left-side navigation pane, click Application Settings.
Click the Custom Configuration tab. In the Pooled Monitoring Configuration section, turn on Thread pool, connection pool monitoring.
View monitoring data
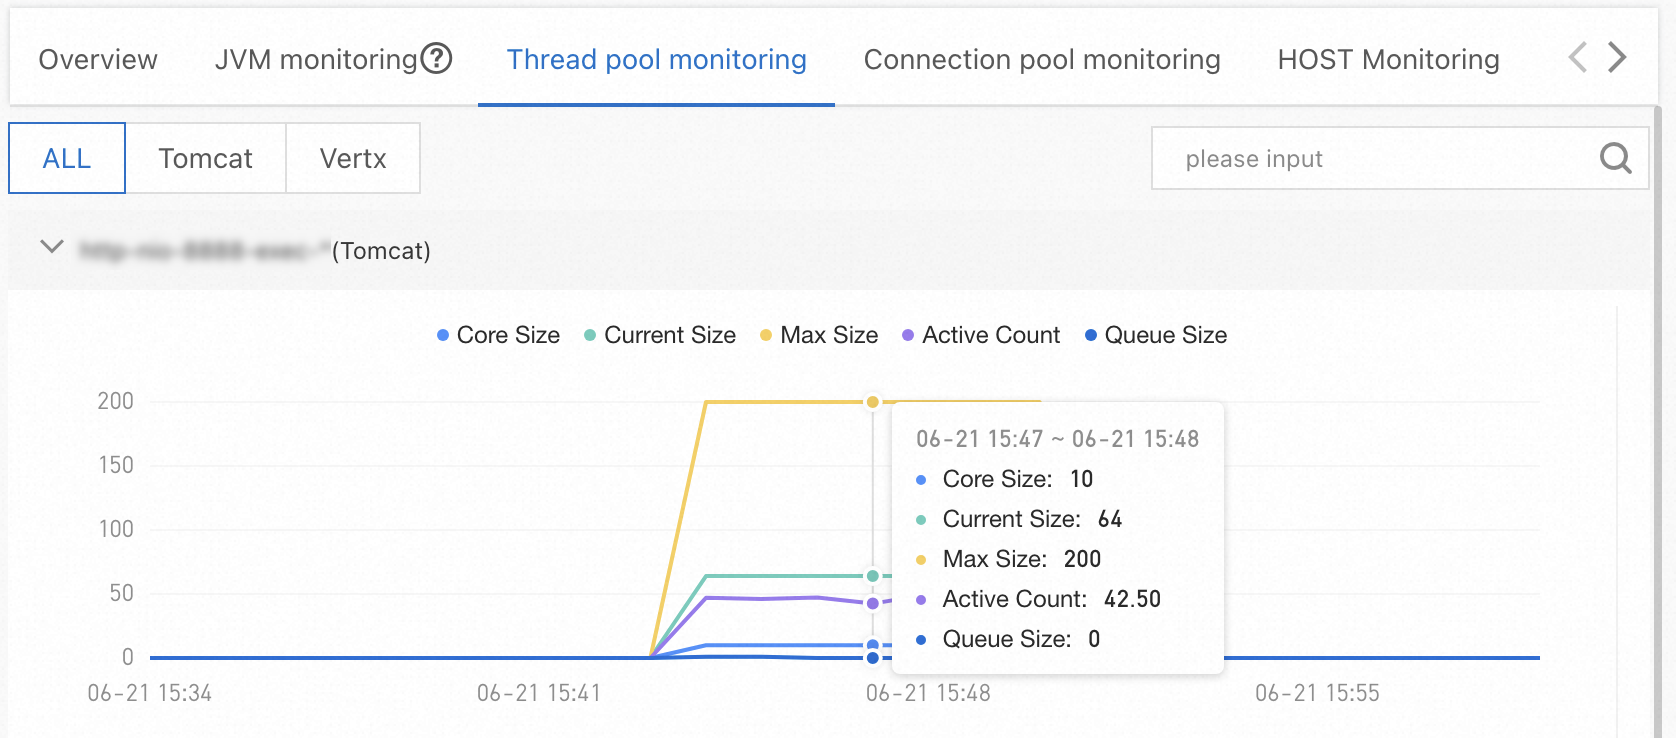
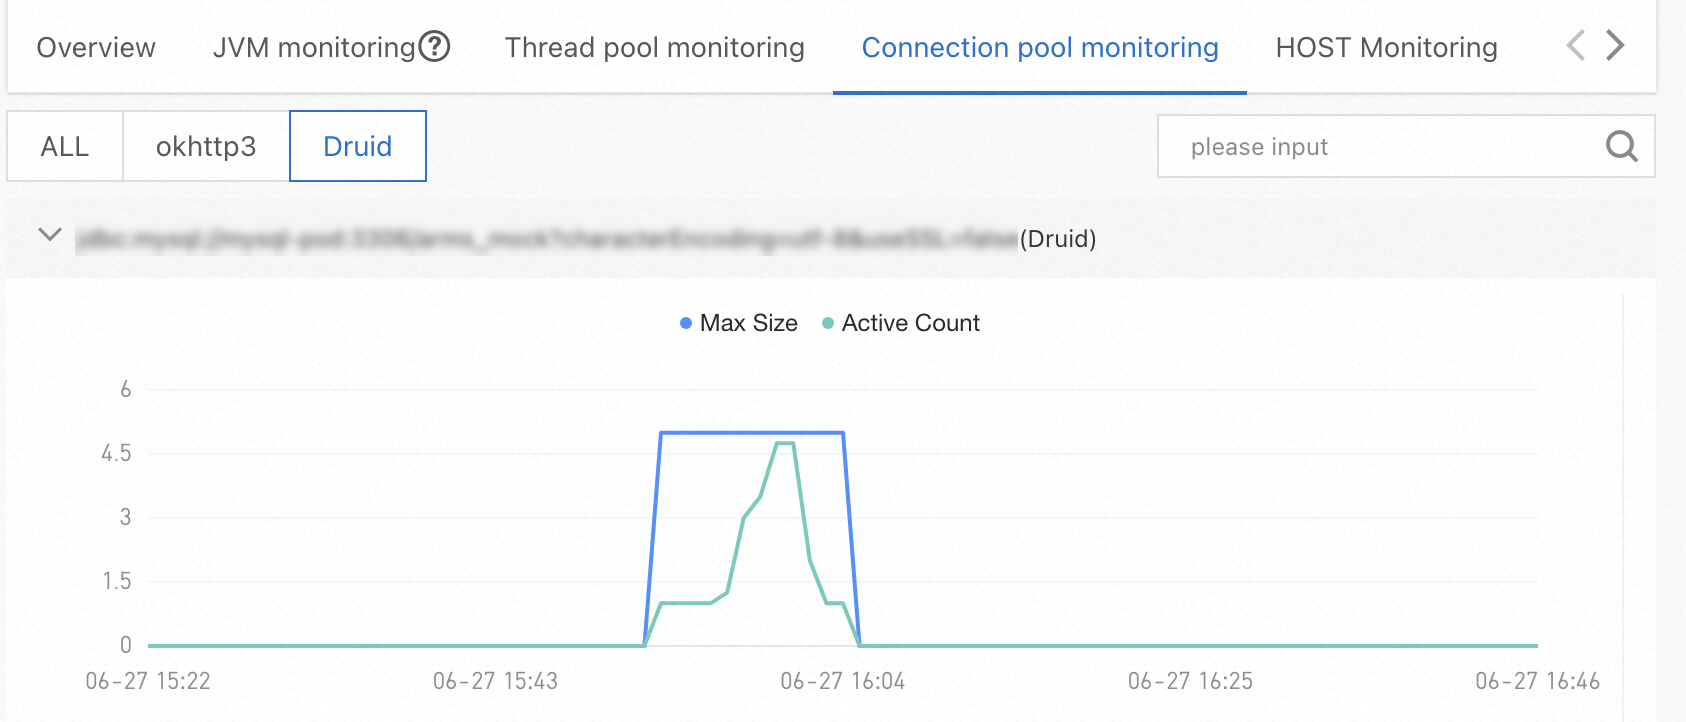
Open the Application Details page for your application. The monitoring data is available on two tabs:
Thread pool monitoring: displays per-pool thread metrics such as core size, active count, and queue depth.
Connection pool monitoring: displays per-pool connection metrics such as total connections, idle connections, and pending requests.
Supported frameworks and metrics
Thread pool frameworks
ARMS agent V4.1.x and later
The following table lists the Java classes that the ARMS agent instruments and their corresponding frameworks.
| Java class | Framework |
|---|---|
java.util.ThreadPoolExecutor | Apache Tomcat 8 to 9.1, Apache Dubbo, HSF (High-speed Service Framework), Vert.x, and user-defined thread pools |
org.apache.tomcat.util.threads.ThreadPoolExecutor | Tomcat 9.1+ |
org.eclipse.jetty.util.thread.QueuedThreadPool | Jetty |
org.xnio.XnioWorker | Undertow |
Thread pool metrics (V4.1.x and later)
| Metric | Description | Supported frameworks |
|---|---|---|
arms_thread_pool_core_pool_size | Core thread count. Configured value, does not change at runtime. | ThreadPoolExecutor (JDK), ThreadPoolExecutor (Tomcat 9.1+), XnioWorker, QueuedThreadPool |
arms_thread_pool_max_pool_size | Maximum thread count. Configured value, does not change at runtime. | ThreadPoolExecutor (JDK), ThreadPoolExecutor (Tomcat 9.1+), XnioWorker, QueuedThreadPool |
arms_thread_pool_active_thread_count | Threads currently running tasks. | ThreadPoolExecutor (JDK), ThreadPoolExecutor (Tomcat 9.1+), XnioWorker, QueuedThreadPool |
arms_thread_pool_current_thread_count | Current thread count, including both active and idle threads. | ThreadPoolExecutor (JDK), ThreadPoolExecutor (Tomcat 9.1+), QueuedThreadPool |
arms_thread_pool_max_thread_count | Peak thread count since pool creation. | ThreadPoolExecutor (JDK), ThreadPoolExecutor (Tomcat 9.1+) |
arms_thread_pool_scheduled_task_count | Total tasks submitted to the pool. | ThreadPoolExecutor (JDK), ThreadPoolExecutor (Tomcat 9.1+) |
arms_thread_pool_completed_task_count | Total tasks that finished execution. | ThreadPoolExecutor (JDK), ThreadPoolExecutor (Tomcat 9.1+) |
arms_thread_pool_rejected_task_count | Total tasks rejected by the pool. A rising count indicates pool saturation. | ThreadPoolExecutor (JDK), ThreadPoolExecutor (Tomcat 9.1+), QueuedThreadPool |
arms_thread_pool_queue_size | Current task queue depth. | ThreadPoolExecutor (JDK), ThreadPoolExecutor (Tomcat 9.1+), XnioWorker, QueuedThreadPool |
ARMS agent earlier than V4.1.x
Agent versions earlier than V4.1.x support thread pool monitoring for the following frameworks: Apache Tomcat, HSF, Apache Dubbo, Vert.x, and Undertow.
Agent V3.1.x and earlier support Undertow V1.x and V2.x only. Agent V3.2.x and later support all Undertow versions.
Thread pool metrics (earlier than V4.1.x)
| Metric | Description |
|---|---|
arms_threadpool_core_size | Core thread count |
arms_threadpool_max_size | Maximum thread count |
arms_threadpool_active_size | Active thread count |
arms_threadpool_queue_size | Task queue size |
arms_threadpool_current_size | Current thread count |
The SchedulerX framework is also supported, with one metric collected:
| Metric | Description |
|---|---|
arms_threadpool_active_size | Active thread count |
Connection pool frameworks
ARMS agent V4.1.x and later
| Framework | Minimum version |
|---|---|
| DBCP | 2.0 |
| Vibur DBCP | 11.0 |
| c3p0 | 0.9.2 |
| Apache Druid | All versions |
| HikariCP | 3.0 |
| Jedis | 3.0 |
| Lettuce | 5.0 |
| Redisson | 3.0 |
| Tomcat DBCP | 8.0 |
| Tomcat JDBC | 8.0 |
Connection pool metrics (V4.1.x and later)
| Metric | Description | Supported frameworks |
|---|---|---|
arms_connection_pool_connection_count | Total connections, including active and idle connections. | DBCP, c3p0, Vibur DBCP, Druid, HikariCP, Jedis, Lettuce, Redisson, Tomcat DBCP, Tomcat JDBC |
arms_connection_pool_connection_min_idle_count | Minimum idle connection count. Configured value, does not change at runtime. | DBCP, Jedis, Druid, HikariCP, Lettuce, Tomcat DBCP, Tomcat JDBC |
arms_connection_pool_connection_max_idle_count | Maximum idle connection count. Configured value, does not change at runtime. | DBCP, Jedis, Druid, Lettuce, Tomcat DBCP, Tomcat JDBC |
arms_connection_pool_connection_max_count | Maximum connection count. Configured value, does not change at runtime. | DBCP, Druid, Vibur DBCP, HikariCP, Tomcat DBCP, Tomcat JDBC |
arms_connection_pool_pending_request_count | Blocked connection requests waiting for an available connection. | c3p0, HikariCP, Jedis, Tomcat DBCP, Tomcat JDBC |
ARMS agent earlier than V4.1.x
Agent versions earlier than V4.1.x support connection pool monitoring for the following frameworks.
OkHttp2 and OkHttp3
| Metric | Description |
|---|---|
arms_threadpool_active_size | Active connection count |
arms_threadpool_current_size | Current connection count |
Apache HttpClient
| Metric | Description |
|---|---|
arms_threadpool_current_size | Current connection count |
arms_threadpool_max_size | Maximum connection count |
arms_threadpool_queue_size | Pending request queue size |
Apache Druid
| Metric | Description |
|---|---|
arms_threadpool_active_size | Active connection count |
arms_threadpool_max_size | Maximum connection count |
HikariCP
| Metric | Description |
|---|---|
arms_threadpool_active_size | Active connection count |
arms_threadpool_max_size | Maximum connection count |