Managed Service for Grafana includes a built-in Tablestore plug-in that lets you query data from a Tablestore instance and visualize it in Grafana dashboard panels. The plug-in supports SQL queries with predefined time-range macros and three display formats: time series charts, multi-dimensional charts (FlowGraph), and tables.
Prerequisites
A Tablestore instance with data you want to visualize
An AccessKey pair with permissions to access the Tablestore instance. See Obtain an AccessKey pair
(Grafana V11.4.x only) AngularJS is enabled. AngularJS is disabled by default in V11.4.x and must be turned on before the Tablestore plug-in can load. To enable it:
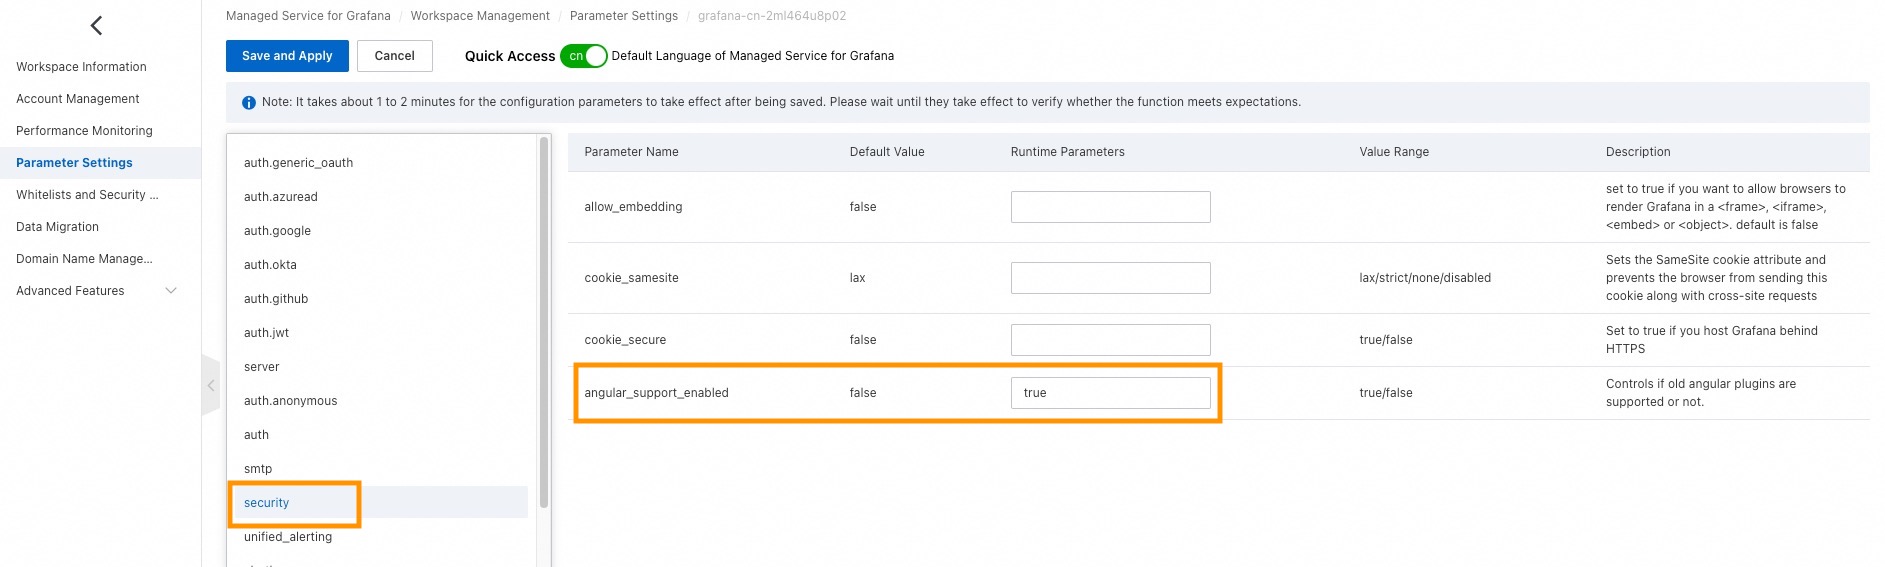
Log on to the ARMS console. In the left-side navigation pane, choose Managed Service for Grafana > Workspace Management.
Click the workspace ID of the Grafana V11.4.x workspace.
In the left-side navigation pane, click Parameter Settings, then click Modify Parameters.
Select security, set angular_support_enabled to true, and click Save and Apply.
Step 1: Log on to Grafana
Log on to the ARMS console. In the left-side navigation pane, choose Managed Service for Grafana > Workspace Management.
On the Workspace Management page, click the URL in the URL column for the target workspace to open Grafana.
Log on with the Grafana administrator account and password configured during workspace creation, or click Sign in with Alibaba Cloud to use your Alibaba Cloud account.
Step 2: Add the Tablestore data source
The following steps apply to Grafana V9.0.x, V10.0.x, and V11.x. Only the navigation paths differ between versions.
Open the data source page.
Grafana version Navigation path V11.x In the left-side navigation pane, choose Connections > Data sources. Click Add new data source. V10.0.x Click the  icon. Choose Management > Data sources. Click + Add new data source.
V9.0.x Hover over the  icon in the left-side navigation pane and select Data sources. Click Add data source.
Search for and select aliyun-tablestore-grafana-datasource.
On the Settings tab, configure the connection parameters. Grafana V11.x and V10.0.x: Grafana V9.0.x:
Parameter Description Name A display name for this data source. Example: aliyun-tablestore-grafana-datasource.Endpoint The endpoint of the Tablestore instance. For details, see the "Query endpoints" section of Endpoints. Instance The name of the Tablestore instance. AccessId The AccessKey ID used to access the Tablestore instance. See Obtain an AccessKey pair. AccessKey The AccessKey secret used to access the Tablestore instance. See Obtain an AccessKey pair. 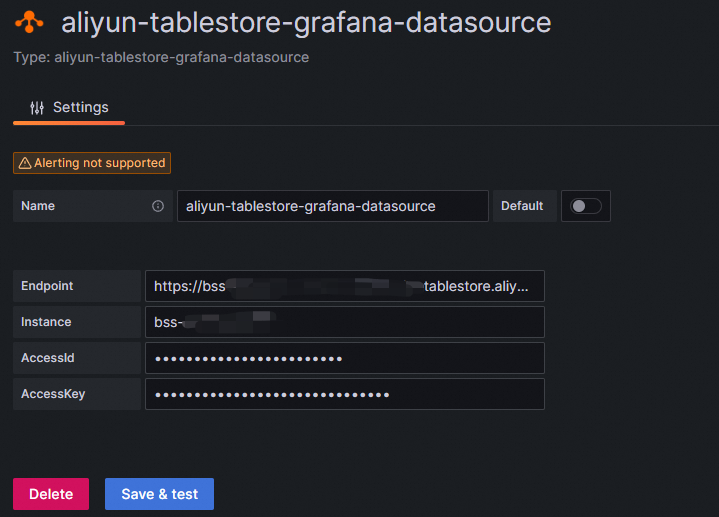
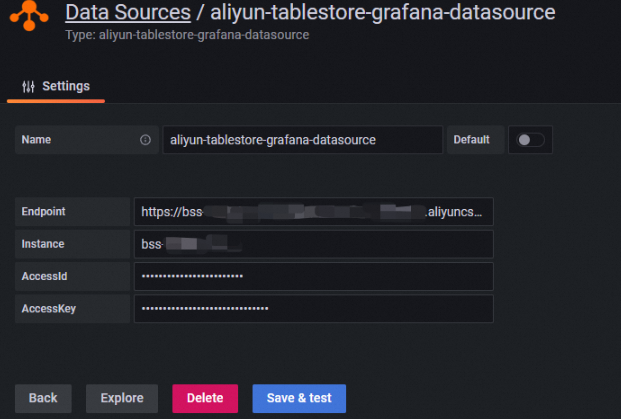
Click Save & test. A
Data source is workingmessage confirms the connection.
Step 3: Create a dashboard panel
Create a new dashboard.
Grafana version Navigation path V11.x In the left-side navigation pane, click Dashboards. In the upper-right corner, choose New > New dashboard. V10.0.x Click the icon. Click Dashboards, then select New dashboard from the New drop-down list.V9.0.x In the left-side navigation pane, click  and select New dashboard.
Add a visualization.
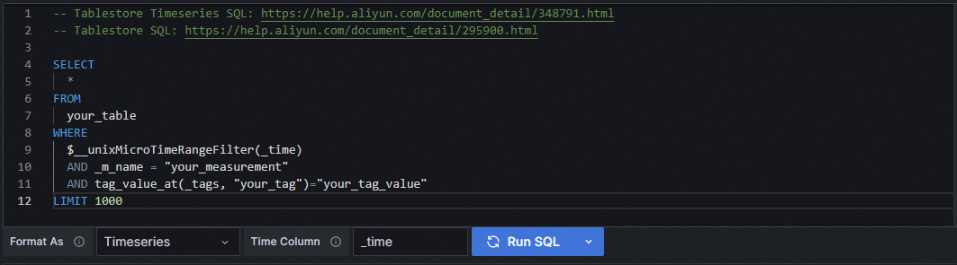
Grafana version Action V11.x / V10.0.x Click + Add visualization, then select the Tablestore data source on the Select data source page. V9.0.x Click Add a new panel. On the Query tab of the Edit Panel page, select the Tablestore data source from the Data source drop-down list. Enter a SQL query in the Query field and click Run SQL. Example query: The
$__unixMicroTimeRangeFiltermacro automatically filters rows by the time range selected in the Grafana dashboard. For the full macro reference and additional query examples, see Use SQL to query time series data. For SQL syntax details, see SQL query.NoteTo display data in a time series chart, the query must return a timestamp column. Specify the column name in the Time Column field.
SELECT
  *
FROM
  your_table
WHERE
  $__unixMicroTimeRangeFilter(_time)
  AND _m_name = "your_measurement"
  AND tag_value_at(_tags, "your_tag")="your_tag_value"
LIMIT 1000
Configure the display format. The following table summarizes which parameters are required for each format. Grafana V11.x and V10.0.x: Grafana V9.0.x:
Parameter Description Format As Determines how results are displayed. Options: Timeseries (time series chart), FlowGraph (multi-dimensional chart), Table (tabular format). Time Column The name of the timestamp column in the query results. Used as the x-axis in time series and FlowGraph charts. Aggregation Column Required only when Format As is set to FlowGraph. Pivots multiple single-value rows at each timestamp into a single multi-value row. Format: <data_point_name_column>#:#<value_column>. Example:"_field_name#:#_double_value".Format Time Column Aggregation Column Timeseries Required Not required FlowGraph Required Required Table Not required Not required 
Save the dashboard.
Grafana version Action V11.x Click Save dashboard in the upper-right corner. Set the dashboard name and folder, then click Save. V10.0.x Click Apply, then click the  icon in the upper-right corner. Set the dashboard name and folder.
V9.0.x Click Apply, then click the icon in the upper-right corner. Set the dashboard name and folder, then click Save.
Step 4: View monitoring data
After saving the dashboard, open it to view the monitoring charts.
| Grafana version | Navigation path |
|---|---|
| V11.x | In the left-side navigation pane, click Dashboards. Open the target folder and click the dashboard. |
| V10.0.x | Click the icon. Click Dashboards, open the target folder, and click the dashboard. |
| V9.0.x | Hover over the icon and select Browse. Open the target folder and click the dashboard. |