Zabbix generates infrastructure alerts, but managing them across multiple Zabbix instances and notification channels becomes difficult at scale. By integrating Zabbix with Application Real-Time Monitoring Service (ARMS), you can forward Zabbix alert events to a centralized alert management platform that provides deduplication, severity mapping, and flexible notification routing.
The integration uses a lightweight connector installed on your Zabbix server. The connector automatically creates a dedicated user, user group, media type, and action in Zabbix to relay alerts to ARMS.
Prerequisites
Before you begin, make sure that you have:
Zabbix version 5.x installed and running
SSH access to the Zabbix server with administrator privileges
Zabbix administrator credentials (username and password)
An Alibaba Cloud account with ARMS activated
Only Zabbix version 5.x is supported.
Create a Zabbix integration in ARMS
This step generates the integration endpoint URL that the Zabbix connector uses to forward alert events.
Log on to the ARMS console. In the left-side navigation pane, choose .
On the Alert Integration tab, click Zabbix.
In the Create Zabbix Integration dialog box, enter a name and description for the integration, specify the automatic recovery time, and then click Save.
NoteIf an alert event is not triggered again within the automatic recovery time, ARMS clears the event automatically.
On the Alert Integration tab, find the Zabbix integration and copy the URL from the Integration Address column. You need this URL in the next section.
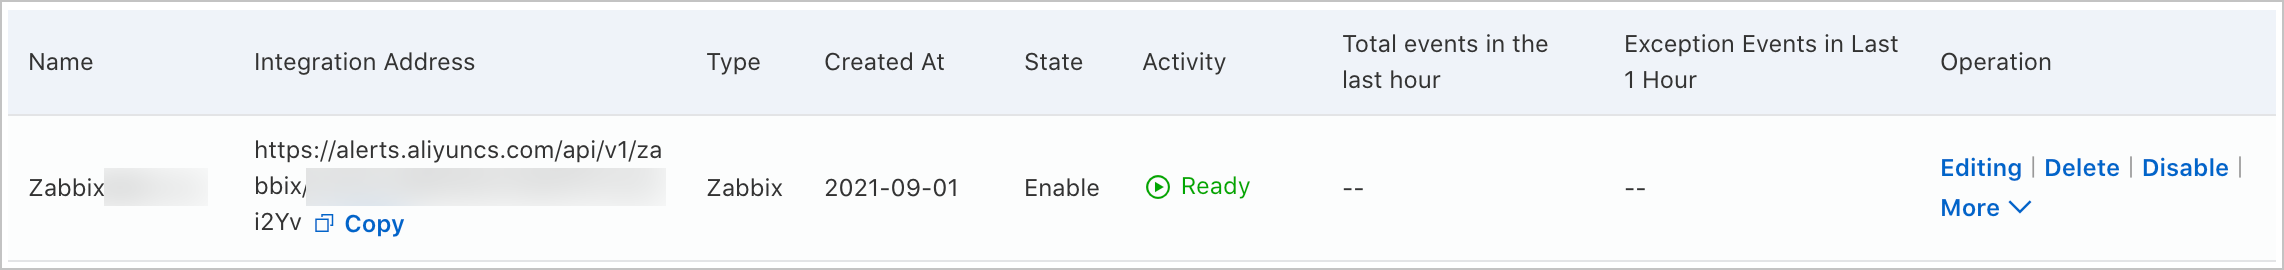
Install the ARMS alert connector on your Zabbix server
This step installs the connector that bridges Zabbix and ARMS. The installer creates the required Zabbix resources (user, user group, media type, and action) automatically.
Log on to the Zabbix server via SSH and find the alert script directory:
cat /etc/zabbix/zabbix_server.conf | grep alert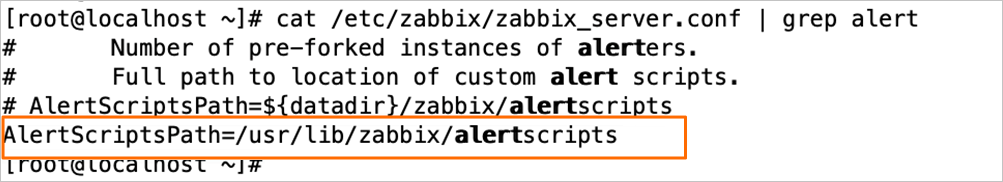
Navigate to the alert script directory, then download and extract the ARMS alert connector package:
   cd <alert-script-directory>
   wget http://arms-public.oss-cn-shanghai.aliyuncs.com/alerts/aliyunalertmanager.tgz
   tar -xzvf aliyunalertmanager.tgz
Run the installer with the integration URL you copied earlier: Replace
<integration-url>with the URL copied from the Integration Address column in ARMS.cd aliyunalertmanager/bin sh install.sh <integration-url>When prompted, enter the following information:
The Zabbix web interface URL (for example,
http://your-server/zabbix)The Zabbix administrator username
The Zabbix administrator password
Verify the integration
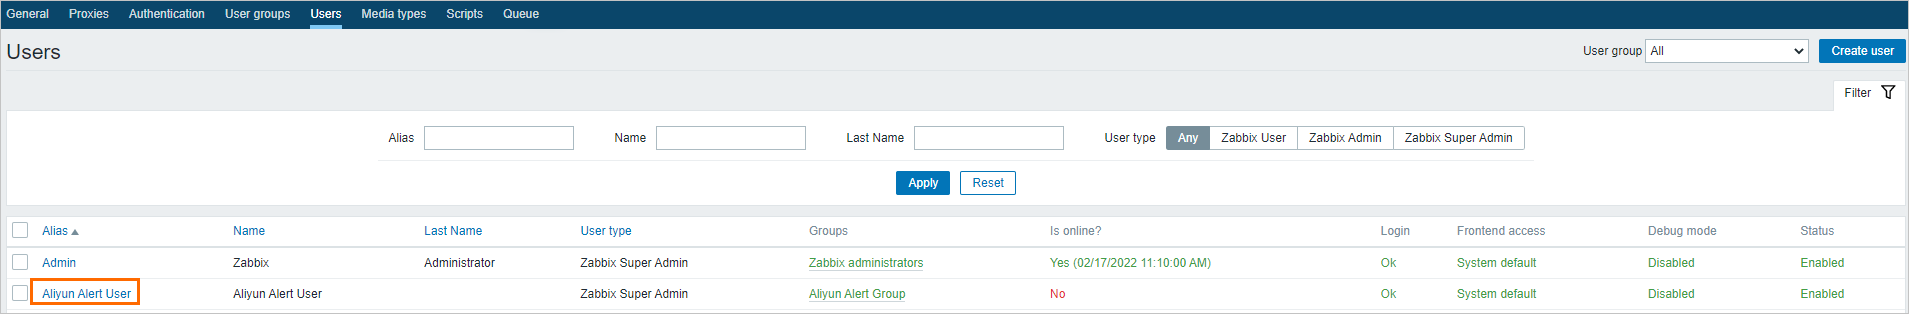
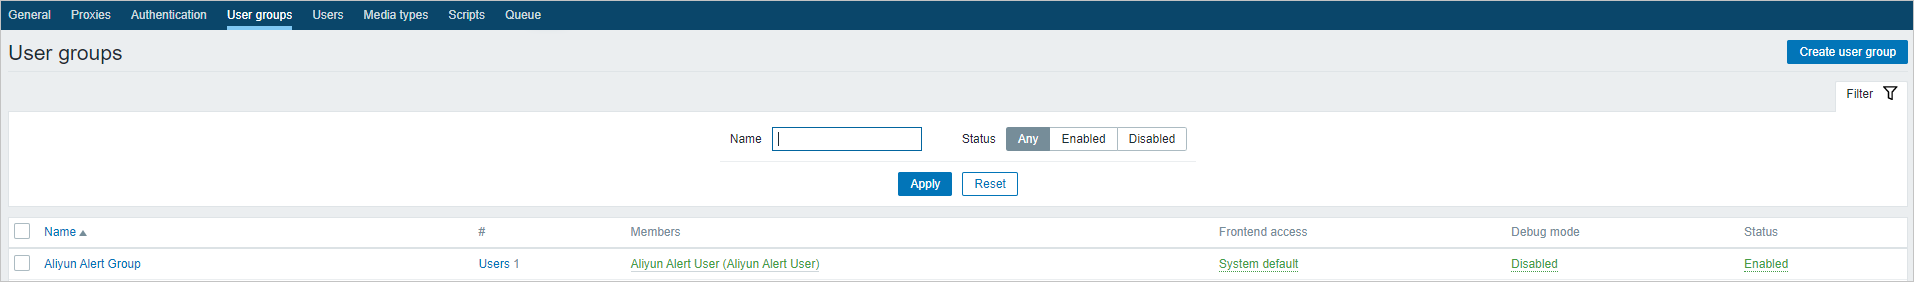
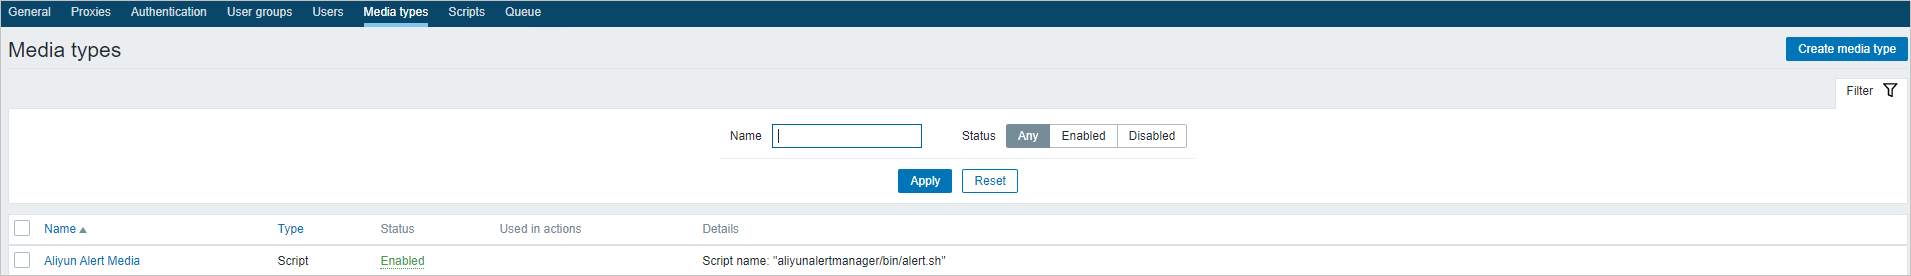
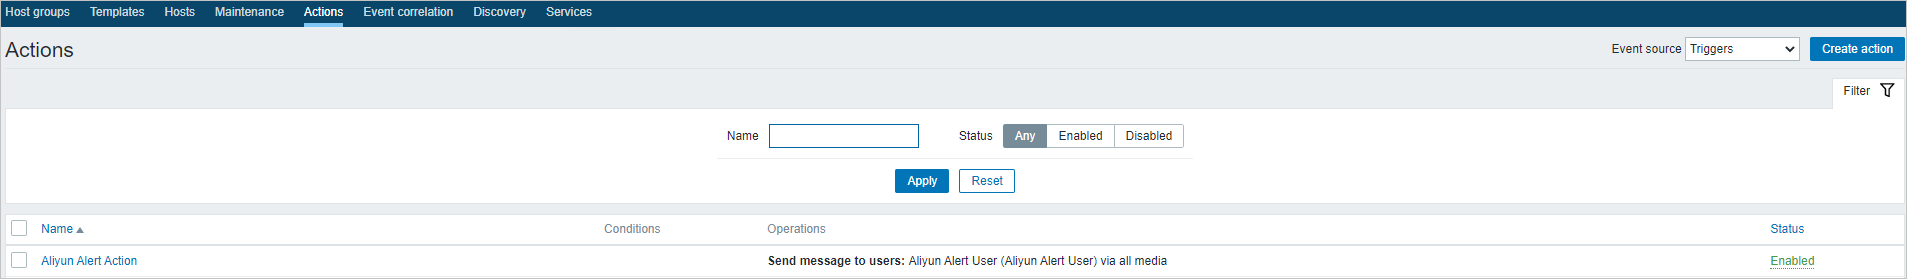
After installation, confirm that the connector created the following four resources in Zabbix:
| Resource type | Navigation path | Expected name |
|---|---|---|
| User | Aliyun Alert User | |
| User group | Aliyun Alert Group (verify that Aliyun Alert User is a member) | |
| Media type | Aliyun Alert Media | |
| Action | Aliyun Alert Action |
To verify end-to-end delivery, trigger a test alert in Zabbix and check whether it appears in the ARMS console under .
Only alert events generated after installation are forwarded to ARMS. Pre-existing events are not reported retroactively. To customize the data reported in alerts, edit the Aliyun Alert Action action in Zabbix.
View alert events in ARMS
In the ARMS console, choose .
Click an alert event name to view its details.
For more information, see View historical alert events.
Customize field mappings
ARMS provides default field mappings between Zabbix alert sources and ARMS alert events. To add or modify mappings, send test data first, then configure the mapping rules.
Send test data
On the Alert Integration tab, find the integration and click Edit in the Actions column.
In the Event Mapping section, click Send Test Data.
In the Send Test Data dialog box, paste alert content in JSON format and click Send. Sample Zabbix alert payload:
If the message Uploaded. No events are generated. Configure mappings based on the original data. appears, the source fields are not yet mapped. The uploaded data appears in the left pane for reference.
If the message Uploaded. appears, the alert was reported to the Alert Event History page.
   {
       "startat": "2021.09.09 20:13:57",
       "eventId": "16874-9756",
       "eventType": "trigger",
       "message": "/: Used space in Zabbix server value is 81 GB, triggered an alarm disk usage trigger",
       "hostname": "Zabbix server",
       "ip": "127.0.0.1",
       "severity": "Warning",
       "value": "81 GB",
       "metric": "vfs.fs.size[/,used]",
       "itemName": "/: Used space",
       "alertname": "disk usage trigger",
       "eventUrl": "http://127.0.0.1/zabbix/tr_events.php?triggerid=16874&eventid=9756"
   }
Click Disable to stop the test data mode.
In the left pane of the Event Mapping section, click a data record to view its details.
Configure batch processing
In the Select Root Node section, enable batch processing if the alert data contains an array node. Select the array node as the root node.
Only one array node can be selected for batch processing.
Map source fields to ARMS alert fields
In the Map Source Fields to Target Fields section, click the mapping icon next to each field to choose a mapping method:
| Method | Description |
|---|---|
| Direct | Maps a source field directly to an ARMS alert field. |
| Series | Concatenates multiple source fields with a delimiter (special characters only) into one ARMS field. |
| Conditional | Maps source fields to ARMS fields only when field values meet specified conditions. |
| Mapping table | Maps alert source severity to ARMS severity. Available for the severity field only. |
The following table lists the available ARMS alert fields:
| Alert field | Description |
|---|---|
alertname | Custom alert name. |
severity | Alert severity level. Must use the Direct mapping method. |
message | Alert description, used as the notification content. Maximum 15,000 characters. |
value | Sample metric value. |
imageUrl | Grafana metrics line chart URL. |
check | Check item, such as CPU, JVM, Application Crash, or Deployment. |
source | Alert source. |
class | Object type that triggers the event, such as host. |
service | Source service, such as Login Service. |
startat | Event start timestamp. |
endat | Event end timestamp. |
generatorUrl | Event details URL. |
Configure event deduplication
To reduce duplicate notifications, ARMS groups events by specified fields. Events with the same value for a deduplication field are merged into one alert.
In the Event Deduplication section, select the fields for deduplication.
Click Deduplication Test to preview the grouping result.
NoteThe deduplication test runs against the 10 most recent data records uploaded in the Event Mapping section. Deduplication applies only to unresolved events.
Click Save.
Manage integrations
On the Alert Integration tab, you can perform the following operations:
| Operation | Steps |
|---|---|
| View details | Click the integration row to open the Integration Details page. |
| Update key | Choose in the Actions column, then click OK. After updating the key, reinstall the alert connector. See Install the ARMS alert connector on your Zabbix server. |
| Edit | Click Edit in the Actions column, modify the settings, and click Save. |
| Enable or disable | Click Enable or Disable in the Actions column. |
| Delete | Click Delete in the Actions column, then click OK. |
| Add event processing flow | Click Add Event Processing Flow in the Actions column. See Work with event processing flows. |
| Create notification policy | Choose in the Actions column. See Create and manage a notification policy. |
What's next
Set up a notification policy to define how ARMS generates alerts and sends notifications for incoming Zabbix events. See Create and manage a notification policy.
To review alerts triggered by your notification policies, see View historical alerts.