Forward Simple Log Service alerts to Application Real-Time Monitoring Service (ARMS) Alert Management through webhooks. This centralizes alert triage, deduplication, and response so you can manage alerts from multiple sources in one place.
How it works
The integration connects Simple Log Service to ARMS Alert Management in three stages:
Ingest -- ARMS generates a unique webhook URL. Simple Log Service posts alert payloads to this URL.
Map and deduplicate -- ARMS maps incoming fields to its standard alert schema and merges duplicate events into single notifications to reduce alert noise.
Notify -- A notification policy routes processed alerts to the channels and responders you configure.
Choose an integration method
| Method | Scope | When to use |
|---|---|---|
| All project alerts | Every alert rule in the selected Simple Log Service projects | Quick setup when all alerts from a project are relevant |
| Specific alert rules (recommended) | Only the alert rules you select | Fine-grained control over which alerts reach ARMS |
Both methods start by creating an integration in ARMS. The specific-alert-rules method adds a webhook configuration step in the Simple Log Service console.
Prerequisites
Before you begin, make sure that you have:
An Alibaba Cloud account with access to both the ARMS console and the Simple Log Service console
At least one Simple Log Service project with alert rules configured
Create an integration
Step 1: Set up the integration in ARMS
Log on to the ARMS console. In the left-side navigation pane, choose Alert Management > Integrations.
On the Alert Integrations tab, click Log Service.
Enter a name and description, and set the automatic recovery time.
NoteIf an alert event is not re-triggered within the specified recovery period, ARMS clears it automatically.
In the Projects Enabling Alert Events section, select the projects whose alerts you want to integrate from the All Projects list, click the
 icon, and then click Save.Note
ARMS traverses all alert rules in the selected projects and rewrites their request URLs to
https://alerts.aliyuncs.com/api/v1/cm/callback/{{token}}, where{{token}}is a key generated automatically when the integration is created.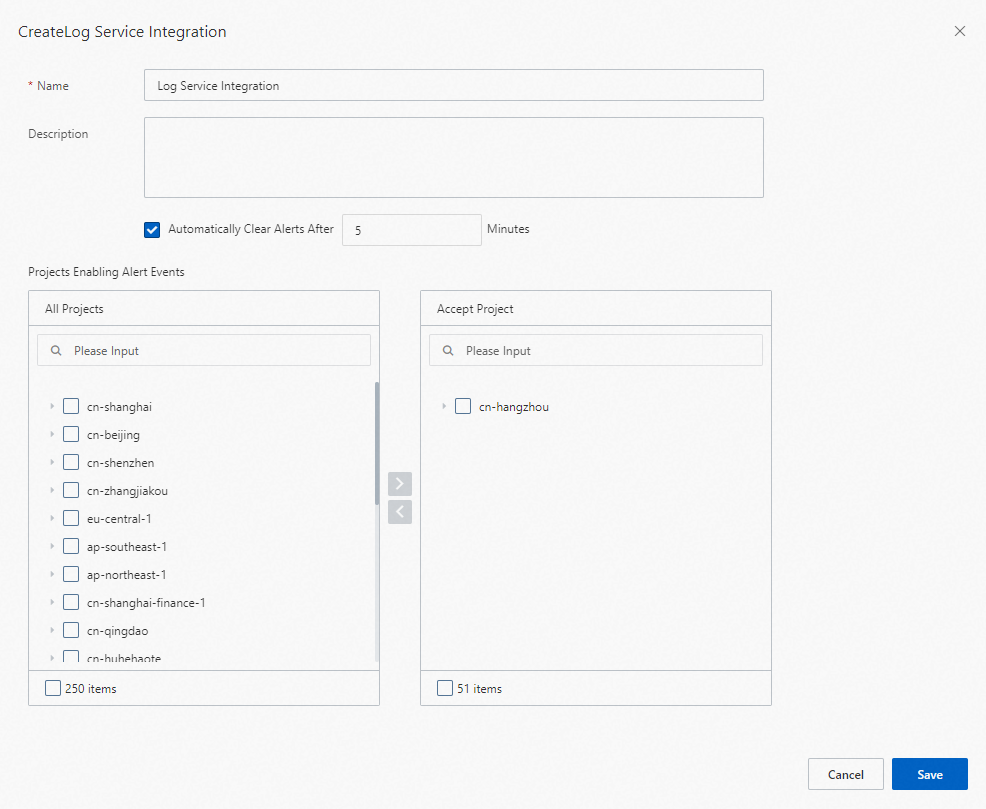
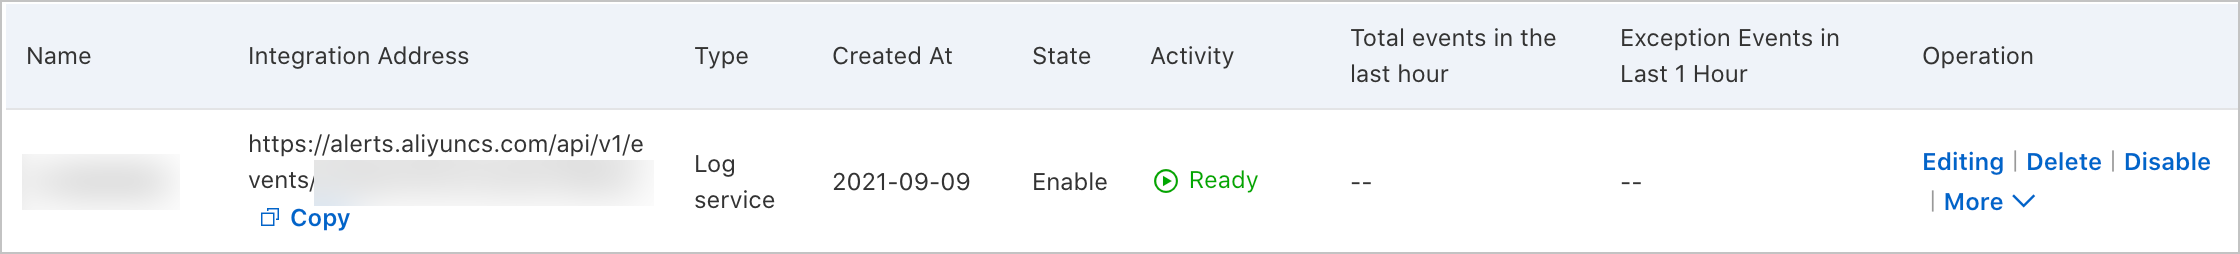
After saving, the new integration appears on the Alert Integrations tab.
If you chose "All project alerts", the setup is complete. Proceed to Configure field mappings to customize event processing, or skip to What's next to set up notifications.
If you chose "Specific alert rules", continue with Step 2.
Step 2: Forward specific alert rules from Simple Log Service
A Simple Log Service integration must already exist in ARMS before you can add specific alert rules. Complete Step 1 first.
In ARMS
On the Alert Integrations tab, find the Simple Log Service integration and copy its URL.
In Simple Log Service
Log on to the Simple Log Service console.
In the Projects section, click the target project name. In the left-side navigation pane, click the
 icon.
icon.On the Alert Center page, choose , and click Create.
Set Name to
Alert Managementand Type to Universal Webhook. Complete the remaining fields as prompted.Choose Notification Policy > Alert Template. Find the alert template and click Edit in the Actions column. On the Webhook-Custom tab, paste the following JSON and click Confirm:
{
  "uid": "{{ alert.aliuid }}",
  "project": "{{ alert.project }}(https://sls.console.alibabacloud.com/#/project/{{ alert.project }}/categoryList)",
  "trigger": "{{ alert.alert_name }}",
  "condition": "{{ alert.condition }}",
  "context": "{{ alert.results[0].raw_results }}",
  "message": " [Uid] {{ alert.aliuid }}\n\n>  [Project] [{{ alert.project }}](https://sls.console.alibabacloud.com/#/project/{{ alert.project }}/categoryList)\n\n> [Trigger] {{ alert.alert_name }}\n\n> [Condition] {{ alert.alert_name }}\n\n> [Message] Notification Content\n\n> [Context] {{ alert.results[0].raw_results }}\n\n> [View Details]({{ alert.query_url }})"
}
Click the Alert Rule tab. Find the target alert rule and click Edit in the Actions column. Expand Advanced Settings, set Destination to Simple Log Service Notification and Alert Policy to Simple Mode, configure the webhook notification method as prompted, and click OK.
Configure field mappings
ARMS provides default field mappings between Simple Log Service alert payloads and ARMS alert events. Modify these mappings on the integration's edit page to match your alert schema.
Send test data
Send sample data before adjusting mappings so the editor has real fields to work with.
On the Alert Integrations tab, find the integration and click Edit.
In the Event Mapping section, click Send Test Data.
Paste alert content in JSON format and click Send.
"Uploaded. No events are generated. Configure mappings based on the original data." -- Fields are not mapped yet. The raw payload appears in the left pane for reference.
"Uploaded." -- The data was accepted and appears on the Alert Event History page. See View historical alert events.
Click Disable in the Send Test Data dialog to exit test mode.
Select a root node (optional)
If the alert payload contains an array node, designate it as the root node so each array element is processed as a separate event.
Only one array node can be selected for batch processing at a time.
In the Select Root Node section, select Use Batch Processing and choose the array node.
Configure alert recovery events (optional)
Select Configure Alert Recovery Events and define the field conditions that clear an active alert. When ARMS receives an event matching these conditions, it clears the corresponding alert.
The field used to clear alerts must represent a status concept equivalent to alert severity, not the $.severity field itself. For example, setting the condition to {$.eventType = "resolved"} clears all alerts whose eventType value is resolved in this integration.
Map source fields to target fields
In the Map Source Fields to Target Fields section, map each alert source field to an ARMS alert field. Click the mapping icon to switch between mapping methods:
| Method | Description |
|---|---|
| Direct | Maps one source field directly to one ARMS field. |
| Series | Concatenates multiple source fields using a delimiter (special characters only), then maps the result to one ARMS field. |
| Conditional | Maps source fields to ARMS fields only when specified conditions are met. |
| Mapping table | Maps alert source severity values to ARMS severity levels. Available for the severity field only. |
ARMS alert field reference
| Field | Description | Notes |
|---|---|---|
alertname | Custom alert name. | |
severity | Severity level. | Must use the Direct mapping method. |
message | Alert description used as the notification message content. | Maximum 15,000 characters. |
value | Sample metric value. | |
imageUrl | URL of a Grafana metrics line chart, displayed in the alert. | |
check | Check item, such as CPU, JVM, Application Crash, or Deployment. | |
source | Alert source. | |
class | Object type that triggers the alert event, such as host. | |
service | Source service, such as Login Service. | |
startat | Timestamp for the event start time. | |
endat | Timestamp for the event end time. | |
generatorUrl | URL linking to event details. |
Configure event deduplication
Deduplication merges events that share the same field value into a single alert notification, reducing noise and alert fatigue.
Deduplication applies only to active (not cleared) events.
In the Event Deduplication section, select the fields to use for deduplication.
Click Deduplication Test to preview how events group after deduplication.
NoteThe test runs against the 10 most recently uploaded records in the Event Mapping section.
Click Save to apply the configuration.
Add projects to an existing integration
To add more Simple Log Service projects to an existing integration:
On the Alert Integrations tab, find the integration, and choose More > Select Service in the Actions column.
In the Select Project dialog, select the project, click the
icon, and click Save.
View alert event details
In the ARMS console, choose Alert Management > Alert Event History.
Click an alert event name to view details. See View historical alert events.
Manage integrations
On the Alert Integrations tab, the following actions are available for each integration:
| Action | Steps |
|---|---|
| View details | Click the integration row to open the Integration Details page. |
| Update the key | Choose More > Update Key and click OK. After the update, re-add project alerts to the integration. See Add projects to an existing integration. |
| Edit | Click Edit in the Actions column, modify settings on the Integration Details page, and click Save. |
| Enable or disable | Click Enable or Disable in the Actions column. |
| Delete | Click Delete in the Actions column, and click OK to confirm. |
| Add an event processing flow | Click Add Event Processing Flow in the Actions column. See Work with event processing flows. |
| Create a notification policy | Choose More > Create Notification Policy. See Create and manage a notification policy. |
What's next
After the integration is active, create a notification policy so ARMS generates alerts and routes notifications for incoming events. See Create and manage a notification policy.
To review past notifications, see View historical alerts.