Grafana is an open-source platform for monitoring and observability that lets you query, visualize, and alert on metrics from multiple data sources. By integrating Grafana with ARMS Alert Management, you can forward Grafana alerts to ARMS for centralized alert handling, notification routing, and incident response.
The integration requires two steps: create an integration endpoint in ARMS, then configure Grafana to send alerts to that endpoint.
Prerequisites
Before you begin, make sure that you have:
An Alibaba Cloud account with Application Real-Time Monitoring Service (ARMS) activated
A running Grafana instance (self-hosted or Grafana Cloud)
Create a Grafana integration in ARMS
Log on to the ARMS console.
In the left-side navigation pane, choose .
On the Alert Integration tab, click Grafana.
In the Create Grafana Integration dialog box, enter the integration name and set the automatic recovery time for alert events, then click Save.
NoteIf an alert event is not triggered again within the automatic recovery time, ARMS automatically clears it.
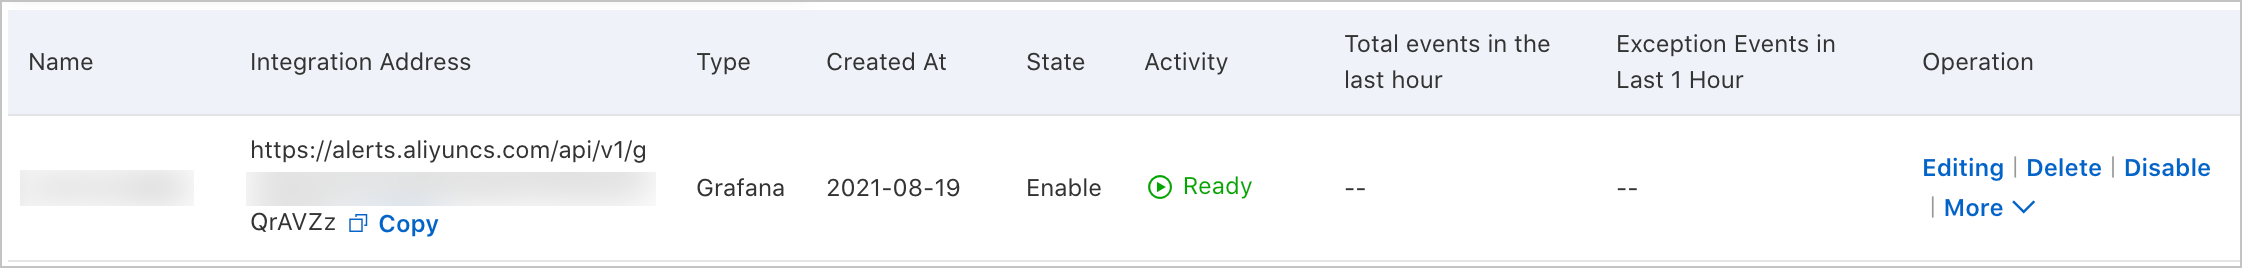
On the Alert Integration tab, find the Grafana integration you created and copy the integration endpoint. You need this URL when configuring Grafana.
Configure Grafana to send alerts to ARMS
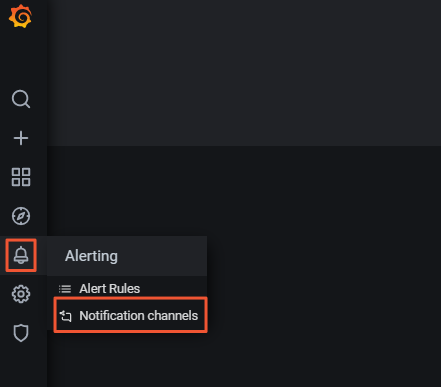
In Grafana, navigate to in the left-side navigation pane.
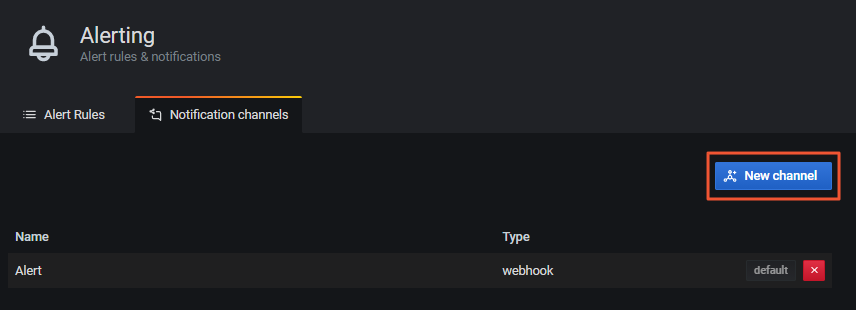
Click New channel. If this is your first notification channel, click Add channel instead.
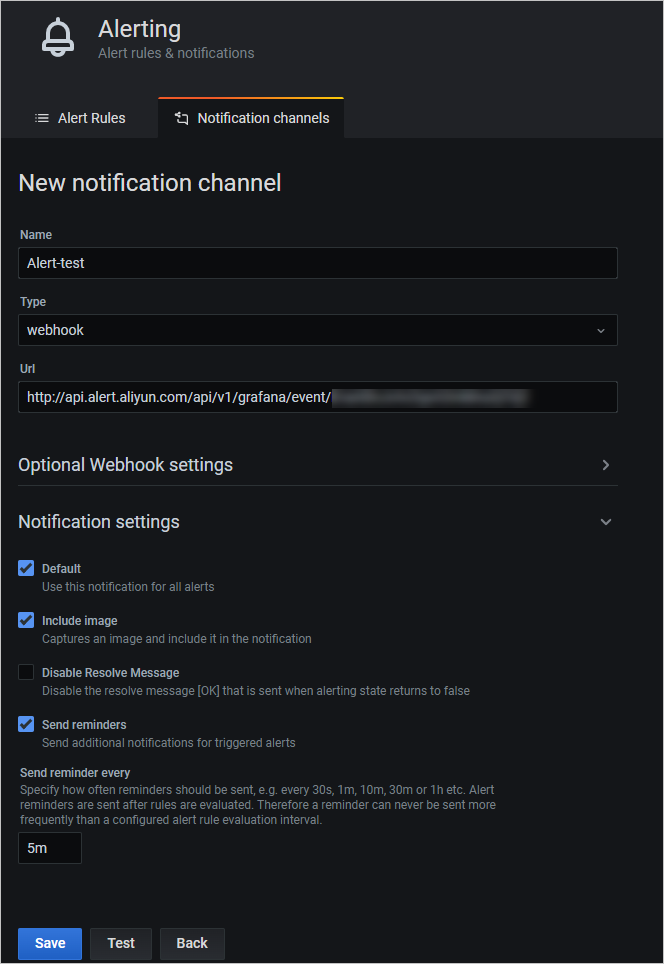
On the New notification channel page, configure the following settings:
Name: Enter a name for this notification channel.
Type: Select webhook.
URL: Paste the integration endpoint copied from ARMS.
Under Notification settings, select the following checkboxes:
Default
Include image
Send reminders -- Sends repeated notifications for active alerts. Set the reminder frequency to a value that does not exceed the automatic recovery time configured in ARMS.
NoteIf you do not select Send reminders, each alert is reported to ARMS only once.
Click Test to verify that Grafana can connect to ARMS Alert Management.
After the test succeeds, click OK.
Verify the integration
After you complete the configuration, Grafana alerts are forwarded to ARMS Alert Management automatically.
To confirm that alerts are arriving:
In the ARMS console, go to .
Click an alert event name to view its details.
For more information, see View historical alert events.
(Optional) Customize field mappings and deduplication
ARMS provides default field mappings between Grafana alert payloads and ARMS alert events. To add or modify these mappings, edit the integration.
Send test data
On the Alert Integration tab, find the Grafana integration and click Edit in the Actions column.
In the Event Mapping section, click Send Test Data.
In the Send Test Data dialog box, enter a sample Grafana alert payload in JSON format, then click Send.
Sample Grafana alert payload:
{
       "@timestamp": "2021-09-09T12:25:09.556Z",
       "orgId": 0,
       "host": "10.1.11.14",
       "ruleName": "Test notification",
       "ruleUrl": "http://localhost:8001/grafana/",
       "state": "alerting",
       "title": "[Alerting] Test notification",
       "panelId": 1,
       "imageUrl": "https://grafana.com/assets/img/blog/mixed_styles.png",
       "evalMatches": [
           {
               "metric": "High value",
               "value": 100,
               "tags": null
           },
           {
               "metric": "Higher Value",
               "value": 200,
               "tags": null
           }
       ],
       "ruleId": 0,
       "tags": {},
       "dashboardId": 1,
       "message": "Someone is testing the alert notification within grafana.",
       "@version": "1"
   }
After sending, one of the following messages appears:
Message Meaning Uploaded. No events are generated. Configure mappings based on the original data. The alert source fields are not yet mapped to ARMS alert event fields. The raw data appears in the left panel so you can select source fields when configuring mappings. Uploaded. The alert was successfully reported to the Alert Event History page. For more information, see View historical alert events. 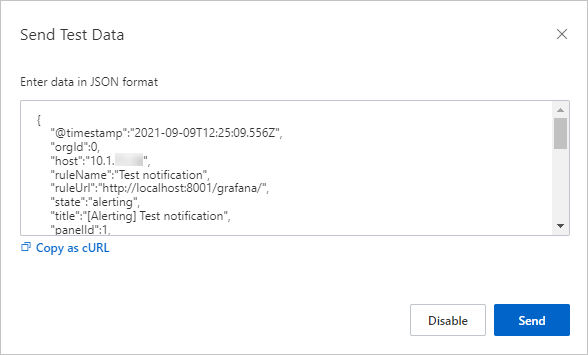
In the Send Test Data dialog box, click Disable.
Configure field mappings
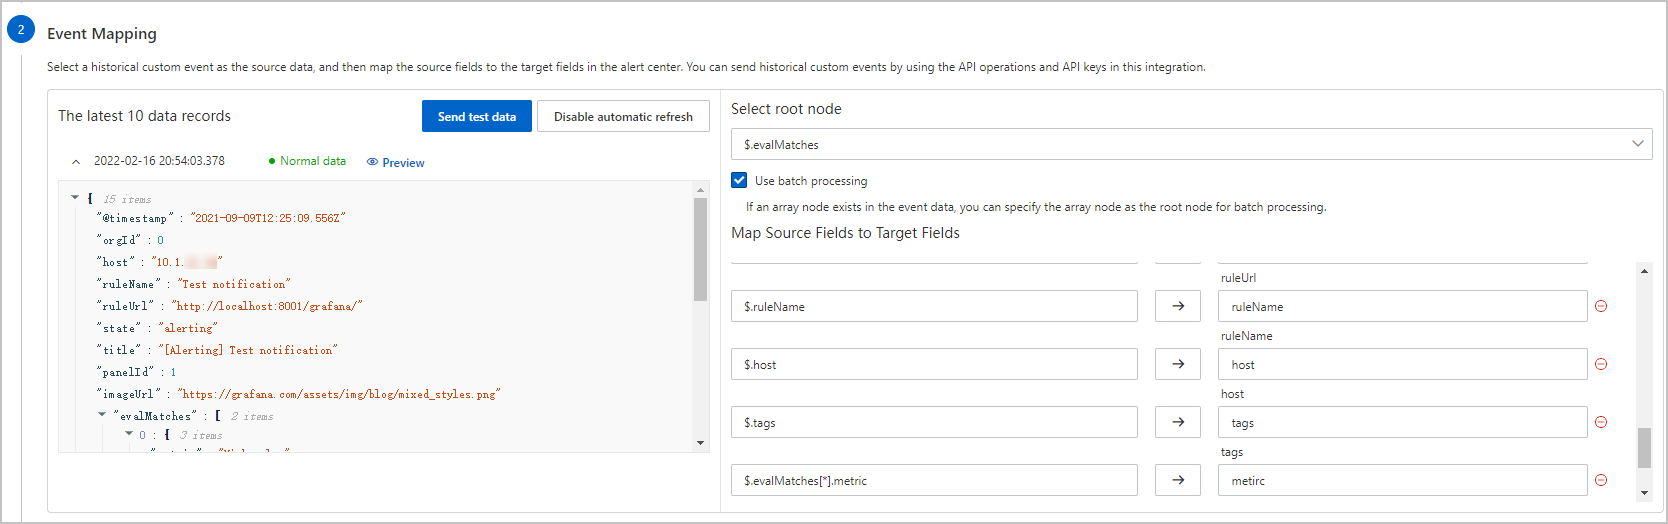
In the left panel of the Event Mapping section, click a data record to view its details. In the right panel, map the Grafana alert source fields to ARMS alert fields.
Select a root node (batch processing)
If the alert payload contains an array node, designate it as the root node to process its elements iteratively.
Select Use Batch Processing, then choose the array node to use as the root node.
Only one array node can be selected for batch processing at a time.
For example, the evalMatches array node in the sample payload above contains two elements, each with a value field:
With batch processing:
$.evalMatches[*].valuemaps allvaluefields in the array to the specified ARMS alert field iteratively.Without batch processing: Map individual elements such as
$.evalMatches[0].valueor$.evalMatches[1].valueto the ARMS alert field separately.
Map source fields to target fields
Click the Map icon to choose one of the following mapping methods:
| Method | Description |
|---|---|
| Direct | Maps a single Grafana field to an ARMS alert field. |
| Series | Concatenates multiple Grafana fields with a delimiter (special characters only), then maps the result to an ARMS alert field. For example, $.host and $.title joined with _ produces $.host_$.title, mapped to the alertname field. |
| Condition | Maps Grafana fields to ARMS alert fields only when field values meet specified conditions. |
| Mapping table | Maps severity levels from the Grafana alert source to ARMS severity levels. Use this method only for the severity field. |
ARMS alert fields reference
| Alert field | Description |
|---|---|
alertname | Custom alert name. |
severity | Alert level. Configure mappings for this field using the Direct method. |
message | Alert description used as the alert notification content. Maximum: 15,000 characters. |
value | Sample metric value. |
imageUrl | URL of the Grafana metrics chart. |
check | Check item of the alert, such as CPU, JVM, Application Crash, or Deployment. |
source | Alert source. |
class | Type of the object that triggers the alert event, such as host. |
service | Source service of the alert, such as Login Service. |
startat | Timestamp for the event start time. |
endat | Timestamp for the event end time. |
generatorUrl | URL of the event details page. |
Configure event deduplication
Event deduplication merges duplicate alert events based on selected fields, reducing noise in your alert notifications.
Deduplication applies only to events that have not been cleared.
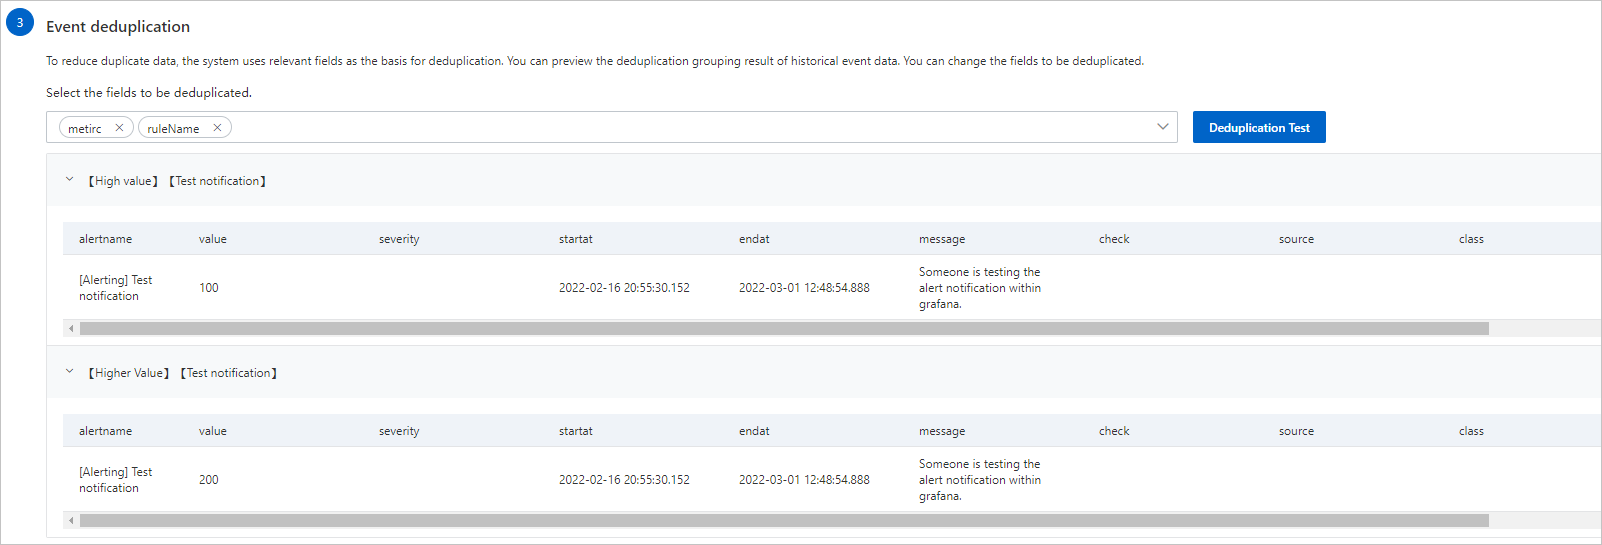
In the Event Deduplication section on the Integration Details page, select the fields to use as deduplication keys.
Events with identical values for all selected fields are merged into a single alert notification. For example, selecting
metricandruleNameas deduplication keys merges events that share the same metric and rule name, while events with different values remain separate.Click Deduplication Test to preview how historical events are grouped after deduplication.
NoteThe deduplication test runs against the 10 most recent data records uploaded in the Event Mapping section.
Click Save.
Manage existing integrations
On the Alert Integration tab (), you can perform the following operations:
| Operation | Steps |
|---|---|
| View integration details | Click the integration row to open the Integration Details page. |
| Update the integration key | Choose in the Actions column, then click OK. |
| Edit an integration | Click Edit in the Actions column, modify the settings, then click Save. |
| Enable or disable an integration | Click Enable or Disable in the Actions column. |
| Delete an integration | Click Delete in the Actions column, then click OK. |
| Add an event processing flow | Click Add Event Processing Flow in the Actions column. For more information, see Work with event processing flows. |
| Create a notification policy | Choose in the Actions column. For more information, see Create and manage a notification policy. |
After you update the integration key, update the webhook URL in your Grafana notification channel to match the new integration endpoint.
What's next
Create a notification policy to control how ARMS generates and routes alert notifications for your Grafana alerts. For more information, see Create and manage a notification policy.
To review alerts generated by your notification policies, see View historical alerts.