Redash is an open source business intelligence (BI) tool that connects to various data sources, including MySQL and PostgreSQL. This topic explains how to connect Redash to AnalyticDB for MySQL — either through an ADB MySQL endpoint or a Spark JDBC endpoint — and run your first query.
Prerequisites
Before you begin, ensure that you have:
-
Redash installed. See the Redash official documentation.
-
The IP address of the Redash server added to the AnalyticDB for MySQL cluster whitelist. See Whitelist.
-
(Required for Spark JDBC only) A Spark Interactive resource group created. See Create the resource group.
Connect Redash to an ADB MySQL endpoint
Gather connection details
Before opening Redash, collect the following values from the AnalyticDB for MySQL console:
| Parameter | Description |
|---|---|
| Host | The endpoint of the AnalyticDB for MySQL cluster. Use the internal endpoint if Redash runs on an Elastic Compute Service (ECS) instance in the same virtual private cloud (VPC) as the cluster. Use the public endpoint if Redash runs outside the VPC (for example, on a local server). |
| Port | Fixed at 3306. |
| User | The database account of the cluster. |
| Password | The password of the database account. |
| Database name | The database in the cluster. |
Add AnalyticDB for MySQL as a data source
-
Open Redash in your browser at
http://<IP address>:<Port number>.-
<IP address>: the IP address of the server where Redash is running. -
<Port number>: the default port is 5000. If port 5000 is already in use, specify a different port when you start Redash.
-
-
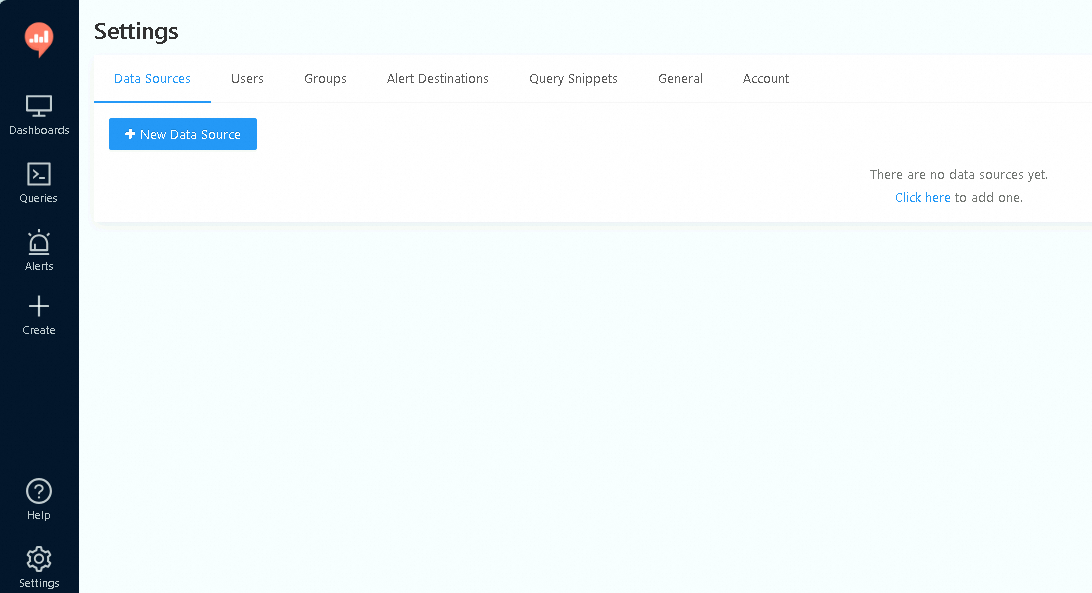
In the navigation pane on the left, click Settings. On the Data Sources tab, click + New Data Source.

-
In the Create a New Data Source dialog box, set Type Selection to mysql — AnalyticDB for MySQL is MySQL-compatible, so the MySQL driver works directly. Enter the connection details you gathered, then click Create.
Parameter Description Type Selection Select mysql from the drop-down list. Name A custom name for this data source. Host The endpoint of the AnalyticDB for MySQL cluster (internal or public — see Gather connection details). Port Fixed at 3306. User The database account of the cluster. Password The password of the database account. Database Name The database in the cluster. 
-
In the navigation pane, choose Create > Query. Enter a SQL statement in the editor and click Execute.

-
After the query runs, click + New Visualization to create a chart from the results. See the Redash official documentation for visualization options.

Connect Redash to a Spark JDBC endpoint
The Spark JDBC connection requires a custom query runner (adb_spark_ds.py) that you install into Redash before adding the data source.
Gather connection details
Before configuring Redash, collect the following values:
| Parameter | Description |
|---|---|
| Host | The endpoint of the Spark Interactive resource group. See Preparations for how to find it. |
| Port | Fixed at 10000. |
| Database | The database in the AnalyticDB for MySQL cluster. |
| Username | The database account of the cluster. |
| Password | The password of the database account. |
| Resource group | The name of the Spark Interactive resource group. |
Prepare the environment
Complete the following steps before adding the data source in Redash. The destination paths differ depending on whether you deployed Redash from source code or from a Docker image.
For Docker deployments,</app folder>refers to the/appfolder inside theredash_server,redash_scheduler,redash_adhoc_worker, andredash_scheduled_workercontainers.
-
(Optional) Copy the adb_spark.png icon file to the following path:
Deployment type Destination path Source code <root directory of the source code>/client/app/assets/images/db-logos/Docker image </app folder>/client/dist/images/db-logos/ -
Copy the adb_spark_ds.py query runner file to the following path:
Deployment type Destination path Source code <root directory of the source code>/redash/query_runner/Docker image </app folder>/redash/query_runner/ -
Add
'redash.query_runner.adb_spark_ds'to thedefault_query_runnerslist in__init__.py: Append the entry at the end of the list:Deployment type File path Source code <root directory of the source code>/redash/settings/__init__.pyDocker image </app folder>/redash/settings/__init__.pydefault_query_runners = [ 'redash.query_runner.athena', 'redash.query_runner.big_query', ........ 'redash.query_runner.uptycs', 'redash.query_runner.adb_spark_ds' ]
Add AnalyticDB for MySQL as a data source
-
Open Redash. In the navigation pane on the left, click Settings. On the Data Sources tab, click + New Data Source.
-
In the Create a New Data Source dialog box, set Type Selection to ADB Spark. Enter the connection details you gathered, then click Create.
Parameter Description Type Selection Select ADB Spark from the drop-down list. Name A custom name for this data source. Host The endpoint of the Spark Interactive resource group. Port Fixed at 10000. Database The database in the AnalyticDB for MySQL cluster. Username The database account of the cluster. Password The password of the database account. Resource Group The name of the Spark Interactive resource group. 
-
In the navigation pane, choose Create > Query. Enter a SQL statement in the editor and click Execute.

-
After the query runs, click + New Visualization to create a chart from the results. See the Redash official documentation for visualization options.
