This topic summarizes common monitoring issues in AnalyticDB for MySQL and provides solutions.
Unless otherwise specified, the solutions in this topic apply only to AnalyticDB for MySQL Data Warehouse Edition and Enterprise Edition.
FAQ overview
Monitor disk usage in reserved mode
Configure monitoring and alerts to prevent disk usage from exceeding the safety threshold. This ensures you receive timely notifications to manage disk space and maintain service stability.
You do not need to configure disk monitoring alerts for Enterprise Edition, Basic Edition, or Data Lakehouse Edition clusters.
Log on to the AnalyticDB for MySQL console. In the upper-left corner of the console, select a region. In the left-side navigation pane, click Clusters. Find the cluster that you want to manage and click the cluster ID.
-
In the left-side navigation pane, click Monitoring and Alerting.
-
On the Monitoring Information page, click the Query and Write tab to view the disk usage.
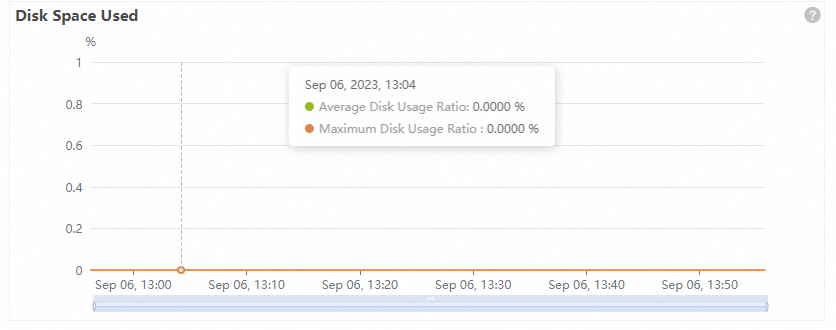
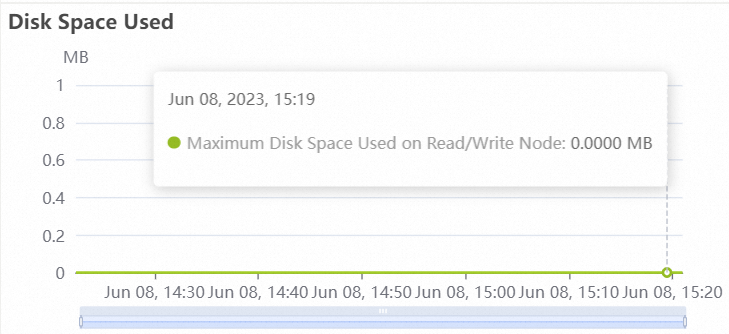
In reserved mode, disk usage is displayed as a percentage. In elastic mode, the absolute disk usage of the read/write nodes is displayed.
-
Reserved mode
 Note
NoteMaximum disk usage is the highest disk usage among all nodes in the cluster. If this value reaches 90% or higher, write operations are locked. Pay close attention to this metric.
-
Elastic mode
 Note
NoteDisk usage refers to the maximum disk usage of a single read/write node. If this value reaches 8 TB or higher, you can no longer write data to the cluster. Pay close attention to this metric.
-
-
On the Monitoring Information page, click Alert Rule Settings.
-
On the Alert Rules page, click Create Alert Rules.
-
On the Create Alert Rule page, configure the parameters.
Parameter
Description
Resource Range
The scope of the alert rule. Valid values:
-
All Resources: This option applies the rule to all instances of a product under your account. For example, if you set an alert to be triggered when the disk usage of AnalyticDB for MySQL is greater than or equal to 80%, the rule applies to all AnalyticDB for MySQL instances. When the Resource Range is set to All Resources, alerts can be triggered for a maximum of 1,000 resources. If the number of resources exceeds 1,000, alerts may not be triggered even if the threshold is reached. We recommend that you use application groups to group resources by business before you configure alerts.
-
Application Group: The alert rule applies to all resources within a specified application group for the product.
-
Instance: The rule applies only to specific instances of the product. For example, if you set an instance-level alert for disk usage to be greater than or equal to 80%, a notification is sent when the disk usage of that specific instance meets or exceeds the threshold.
Rule Description
The conditions that trigger the alert. To configure the rule description:
-
Click Add Rule.
-
In the Add Rule Description panel, set parameters such as Rule Name, Metric Type, Monitoring Metric, Threshold and Alert Level, and Chart Preview.
-
Click OK.
Mute Period
The interval between repeated notifications for an unresolved alert. Valid values: 5 minutes, 15 minutes, 30 minutes, 60 minutes, 3 hours, 6 hours, 12 hours, and 24 hours. When a metric reaches the alert threshold, an alert is sent. If the metric continues to exceed the threshold during the mute period, no repeated notifications are sent. If the condition is not resolved after the mute period ends, CloudMonitor sends another alert notification.
Effective Time
The period during which the alert rule is active.
ImportantFor disk usage alerts, each alert contact is notified a maximum of four times per day. Subsequent alerts are silenced.
Alert Contact Group
The contact group that receives alert notifications.
Notifications for application groups are sent to the contacts in this alert contact group. An alert contact group can contain one or more alert contacts. For information about how to create alert contacts and alert contact groups, see Create an alert contact or an alert contact group.
Alert Callback
A publicly accessible URL. CloudMonitor pushes alert information to this URL through POST requests. Only the HTTP protocol is supported. For information about how to set up an alert callback, see Use threshold-based alert callbacks.
NoteClick Advanced Settings to configure this parameter.
Auto Scaling
If you enable Auto Scaling, the corresponding scaling rule is triggered when an alert occurs. You must specify the Region, ESS Group, and ESS Rule for Auto Scaling.
-
For information about how to create a scaling group, see Configure a scaling group.
-
For information about how to create a scaling rule, see Configure a scaling rule.
NoteClick Advanced Settings to configure this parameter.
Simple Log Service
If you enable Simple Log Service, alert information is written to Log Service when an alert occurs. You must specify the Region, Project, and Logstore for Log Service.
For information about how to create a Project and a Logstore, see Collect and analyze ECS text logs by using LoongCollector.
NoteClick Advanced Settings to configure this parameter.
Simple Message Queue (formerly MNS) - Topic
If you enable Simple Message Queue (formerly MNS) - Topic, alert information is sent to a specified topic in Message Service. You must specify the region and topic for Message Service.
For information about how to create a topic, see Create a topic.
Method for handling alerts when no monitoring data is available
The action to perform when monitoring data is unavailable for an alert rule. Valid values:
-
Do not do anything (default)
-
Send alert notifications
-
Consider as recovered
NoteClick Advanced Settings to configure this parameter.
Tag
Adds custom key-value pairs as tags to the alert content.
-
-
After you configure the parameters, click OK.
View hot and cold data storage
Log on to the AnalyticDB for MySQL console. On the Monitoring Information page, you can view the Hot Data Space Used and Cold Data Space Used.
Check table size
Log on to the AnalyticDB for MySQL console. On the Monitoring Information page for your cluster, click the Table Information Statistics tab to view information such as table size.
Hot data usage vs. total disk usage
An AnalyticDB for MySQL cluster contains multiple storage nodes. Disk usage represents the maximum disk usage of a single read/write node, whereas hot data usage is the sum of disk usage across all read/write nodes.
Increased CPU utilization in elastic mode
When you change a C32 cluster from reserved mode to elastic mode, the core count of a single node is reduced to 8. By default, a BUILD task occupies 3 cores, which leads to an increase in average CPU utilization. If this increase does not affect your services, no action is required. If your services are affected, scale up the cluster or Submit a ticket to contact technical support. For more information about BUILD tasks, see BUILD.
Discrepancy in query response time
The query response time on the Monitoring Information page and the total duration on the Diagnostics and Optimization page are calculated differently. The query response time on the Monitoring Information page also includes the result set cache time. Therefore, if a query returns a large result set that requires caching, the query response time on the Monitoring Information page is longer than the total duration shown on the Diagnostics and Optimization page. You can use the SQL Audit page to find SQL statements with long response times.
The following information describes how the time consumed by an SQL statement is calculated:
After an SQL statement is submitted to AnalyticDB for MySQL, it is first placed in a queue. If query concurrency is high, this can result in a long queuing time. After leaving the queue, the statement enters the execution engine, which parses the query and generates an execution plan, a process that constitutes the execution plan time. After the execution plan is generated, subtasks run on storage and compute nodes, which constitutes the execution time. After the query is complete, if the result set is large, the frontend node caches the results, which constitutes the result set cache time. The following figure shows the time breakdown of an SQL statement: