Mixerless Telemetry collects metrics directly from Envoy sidecar proxies, bypassing the deprecated Mixer component. This reduces resource overhead and latency while providing the same telemetry data: request rates, error rates, and request duration (RED metrics).
This guide covers setting up a self-managed Prometheus instance to scrape these metrics from a Service Mesh (ASM) instance. The same metrics are also available through Managed Service for Prometheus.
How it works
Envoy sidecar proxies in each pod emit telemetry data at localhost:15090/stats/prometheus. Prometheus scrapes this endpoint on a schedule, collecting metrics such as istio_requests_total and istio_request_duration_milliseconds. No application code changes are required -- all data collection happens at the proxy layer.
Standard Istio metrics:
| Metric | Type | Description |
|---|---|---|
istio_requests_total | Counter | Total number of requests handled by the proxy |
istio_request_duration_milliseconds | Histogram | Request duration distribution |
Key labels in these metrics:
| Label | Description |
|---|---|
reporter | source (client proxy) or destination (server proxy) |
source_workload | Name of the source workload |
destination_workload | Name of the destination workload |
response_code | HTTP response status code |
request_protocol | http or grpc |
connection_security_policy | mutual_tls or unknown |
Prerequisites
Before you begin, make sure that you have:
A cluster added to the ASM instance
The Istio installation package downloaded and decompressed
kubectl configured to connect to the cluster. For more information, see Obtain the kubeconfig file of a cluster and use kubectl to connect to the cluster
Step overview
The required steps depend on your ASM version:
| ASM version | Required steps |
|---|---|
| Earlier than 1.17.2.35 | Steps 1 through 4 (all steps) |
| 1.17.2.35 or later | Steps 1, 3, and 4 (skip Step 2) |
Step 1: Install Prometheus
The Prometheus deployment in the Istio samples directory is for demonstration only. It lacks persistent storage, resource tuning, and security hardening. For production environments, deploy a dedicated Prometheus instance with appropriate retention, storage, and access controls.
Deploy Prometheus from the Istio samples directory:
kubectl --kubeconfig <kubeconfig-path> apply -f <istio-package-path>/samples/addons/prometheus.yamlReplace the following placeholders:
| Placeholder | Description | Example |
|---|---|---|
<kubeconfig-path> | Path to the kubeconfig file for your cluster | ~/.kube/config |
<istio-package-path> | Path to the decompressed Istio installation package | ~/istio-1.20.0 |
Step 2: Enable metrics collection in ASM
This step applies only to ASM versions earlier than 1.17.2.35. If your ASM version is 1.17.2.35 or later, skip to Step 3.
Log on to the ASM console. In the left-side navigation pane, choose Service Mesh > Mesh Management.
On the Mesh Management page, click the name of the ASM instance. In the left-side navigation pane, choose Observability Management Center > Monitoring indicators.
On the Monitoring indicators page, select Integrate the self-built Prometheus to achieve metrics monitoring, and confirm that the relevant parameter configuration has been completed according to the corresponding documents. Then, click Collect Metrics to Managed Service for Prometheus.
In the Submit dialog box, click OK.
For more information about self-managed Prometheus integration, see Monitor ASM instances by using a self-managed Prometheus instance.
Step 3: Configure Prometheus scrape targets
Update the Prometheus ConfigMap with Istio-specific scrape configurations, then restart the Prometheus pod to apply the changes.
Update the ConfigMap
Log on to the ACK console. In the left-side navigation pane, click Clusters.
On the Clusters page, find your cluster and click its name or click Details in the Actions column.
In the left-side navigation pane, choose Configurations > ConfigMaps.
On the ConfigMap page, select istio-system from the Namespace drop-down list. Find the ConfigMap named prometheus and click Edit in the Actions column.
In the Edit panel, paste the scrape configuration into the Value field and click OK. Get the scrape configuration from GitHub.
Restart Prometheus to apply changes
In the left-side navigation pane, choose Workloads > Pods.
On the Pods page, find the pod whose name contains prometheus. Choose More > Delete in the Actions column.
In the Note dialog box, click OK. Kubernetes automatically recreates the pod with the updated configuration.
Verify the scrape configuration
Run the following command to confirm that the expected scrape jobs appear:
kubectl --kubeconfig <kubeconfig-path> get cm prometheus -n istio-system -o jsonpath='{.data.prometheus\.yml}' | grep job_nameExpected output:
- job_name: 'istio-mesh'
- job_name: 'envoy-stats'
- job_name: 'istio-policy'
- job_name: 'istio-telemetry'
- job_name: 'pilot'
- job_name: 'sidecar-injector'
- job_name: prometheus
  job_name: kubernetes-apiservers
  job_name: kubernetes-nodes
  job_name: kubernetes-nodes-cadvisor
- job_name: kubernetes-service-endpoints
- job_name: kubernetes-service-endpoints-slow
  job_name: prometheus-pushgateway
- job_name: kubernetes-services
- job_name: kubernetes-pods
- job_name: kubernetes-pods-slow
Step 4: Generate and verify metrics
Deploy a sample application, send traffic to it, and confirm that the Envoy sidecars emit Istio metrics.
Deploy the podinfo application
Create a file named
podinfo.yamlwith the following content:apiVersion: apps/v1 kind: Deployment metadata: name: podinfo spec: minReadySeconds: 3 revisionHistoryLimit: 5 progressDeadlineSeconds: 60 strategy: rollingUpdate: maxUnavailable: 0 type: RollingUpdate selector: matchLabels: app: podinfo template: metadata: annotations: prometheus.io/scrape: "true" prometheus.io/port: "9797" labels: app: podinfo spec: containers: - name: podinfod image: registry-cn-hangzhou.ack.aliyuncs.com/ack-demo/podinfo:6.7.1 imagePullPolicy: IfNotPresent ports: - name: http containerPort: 9898 protocol: TCP - name: http-metrics containerPort: 9797 protocol: TCP - name: grpc containerPort: 9999 protocol: TCP command: - ./podinfo - --port=9898 - --port-metrics=9797 - --grpc-port=9999 - --grpc-service-name=podinfo - --level=info - --random-delay=false - --random-error=false env: - name: PODINFO_UI_COLOR value: "#34577c" livenessProbe: exec: command: - podcli - check - http - localhost:9898/healthz initialDelaySeconds: 5 timeoutSeconds: 5 readinessProbe: exec: command: - podcli - check - http - localhost:9898/readyz initialDelaySeconds: 5 timeoutSeconds: 5 resources: limits: cpu: 2000m memory: 512Mi requests: cpu: 100m memory: 64Mi volumeMounts: - name: data mountPath: /data volumes: - name: data emptyDir: {} --- apiVersion: v1 kind: Service metadata: name: podinfo spec: type: ClusterIP selector: app: podinfo ports: - name: http port: 9898 protocol: TCP targetPort: http - port: 9999 targetPort: grpc protocol: TCP name: grpcDeploy the application:
kubectl apply -f podinfo.yaml
Generate traffic
Send 10 HTTP requests to the podinfo service to generate metric data:
podinfo_pod=$(kubectl get po -n test -l app=podinfo -o jsonpath='{.items..metadata.name}')
for i in {1..10}; do
   kubectl --kubeconfig "$USER_CONFIG" exec $podinfo_pod -c podinfod -n test -- curl -s podinfo:9898/version
  echo
done
Check Envoy metrics
After sending traffic, verify that the Envoy sidecar emits Istio metrics.
Check istio_requests_total:
kubectl --kubeconfig <kubeconfig-path> exec $podinfo_pod -n test -c istio-proxy -- curl -s localhost:15090/stats/prometheus | grep istio_requests_totalExpected output (abbreviated):
# TYPE istio_requests_total counter
istio_requests_total{response_code="200",reporter="destination",source_workload="podinfo",...,connection_security_policy="mutual_tls",...} 10
istio_requests_total{response_code="200",reporter="source",source_workload="podinfo",...,connection_security_policy="unknown",...} 10
Both the destination reporter (server-side proxy) and source reporter (client-side proxy) record 10 requests, matching the number of curl requests sent.
Check istio_request_duration_milliseconds:
kubectl --kubeconfig <kubeconfig-path> exec $podinfo_pod -n test -c istio-proxy -- curl -s localhost:15090/stats/prometheus | grep istio_request_durationExpected output (abbreviated):
# TYPE istio_request_duration_milliseconds histogram
istio_request_duration_milliseconds_bucket{response_code="200",reporter="destination",...,le="0.5"} 10
istio_request_duration_milliseconds_bucket{response_code="200",reporter="destination",...,le="1"} 10
...
All 10 requests fall within the 0.5 ms bucket, indicating sub-millisecond response times.
Verify in Prometheus
After confirming that Envoy emits the expected metrics, verify that Prometheus scrapes and stores them.
Expose Prometheus through a Classic Load Balancer (CLB) instance. For more information, see Service management.
In the left-side navigation pane of the cluster details page, choose Network > Services.
On the Services page, find the service whose name contains prometheus and click the IP address in the External IP column.
On the Prometheus page, enter
istio_requests_totalin the expression input box and click Execute. The results confirm that Prometheus successfully collects service mesh metrics from the Envoy sidecars.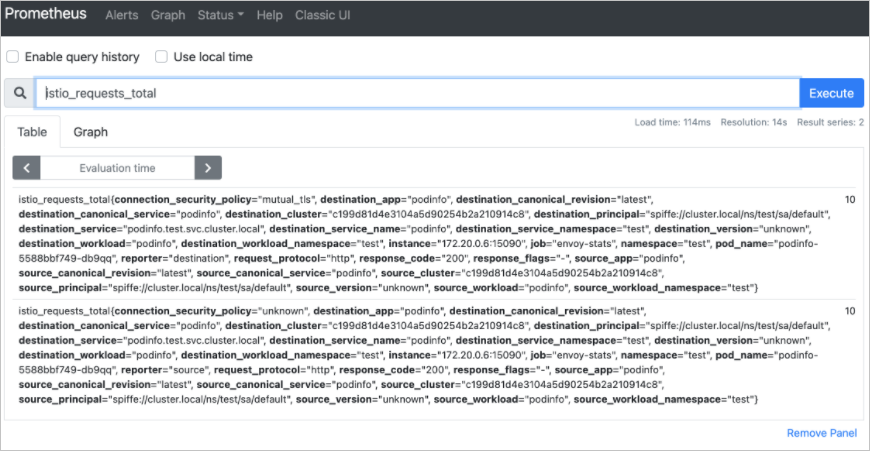
What's next
Monitor ASM instances by using a self-managed Prometheus instance -- Configure advanced Prometheus monitoring for ASM