After you enable Prometheus monitoring for a Service Mesh (ASM) instance, Envoy sidecar proxies generate a set of default metrics for HTTP, HTTP/2, gRPC, and TCP traffic. You can customize these metrics at the mesh, namespace, or workload level -- add dimensions, remove tags, or disable specific metrics to match your observability requirements.
Prerequisites
Add a cluster to the ASM instance. For more information, see Add a cluster to an ASM instance.
How metric customization works
ASM generates default Istio metrics through Envoy sidecar proxies. Each metric includes a set of default tags (also called dimensions or labels) that provide request-level metadata such as source workload, destination service, and protocol.
You can perform the following operations on these metrics:
Add tags to capture additional metadata, such as custom headers or request attributes.
Remove tags to reduce metric cardinality and lower storage costs.
Enable or disable specific metrics per direction (client-side or server-side).
Configuration scope
Custom metric configurations follow a three-level hierarchy. A more specific scope overrides the broader one:
Global (mesh-wide) -- Applies to all workloads across the mesh.
Namespace -- Overrides global settings for all workloads in a specific namespace.
Workload -- Overrides namespace settings for a single workload, selected by label.
ASM gateways export only client-side metrics. Sidecars export both client-side and server-side metrics.
Default metrics
HTTP, HTTP/2, and gRPC metrics
| Metric | Prometheus name | Type | Description |
|---|---|---|---|
| Request count | istio_requests_total | COUNTER | Incremented for every request handled by an Istio proxy. |
| Request duration | istio_request_duration_milliseconds | DISTRIBUTION | Measures the duration of requests. |
| Request size | istio_request_bytes | DISTRIBUTION | Measures HTTP request body sizes. |
| Response size | istio_response_bytes | DISTRIBUTION | Measures HTTP response body sizes. |
| gRPC request message count | istio_request_messages_total | COUNTER | Incremented for every gRPC message sent from a client. |
| gRPC response message count | istio_response_messages_total | COUNTER | Incremented for every gRPC message sent from a server. |
TCP metrics
| Metric | Prometheus name | Type | Description |
|---|---|---|---|
| TCP bytes sent | istio_tcp_sent_bytes_total | COUNTER | Total bytes sent during a response over a TCP connection. |
| TCP bytes received | istio_tcp_received_bytes_total | COUNTER | Total bytes received during a request over a TCP connection. |
| TCP connections opened | istio_tcp_connections_opened_total | COUNTER | Incremented for every opened TCP connection. |
| TCP connections closed | istio_tcp_connections_closed_total | COUNTER | Incremented for every closed TCP connection. |
Default tags
Every metric includes the following default tags:
| Tag | Description |
|---|---|
reporter | Identifies the reporting proxy. Value is destination for server-side proxies, or source for client-side proxies and gateways. |
source_namespace | Namespace of the source workload. |
source_workload | Name of the source workload. Defaults to unknown. |
source_workload_namespace | Namespace of the source workload. Defaults to unknown. |
source_principal | Peer principal of the traffic source. Populated only when peer authentication is configured. |
source_app | Source application, identified by the app label on the source workload. Defaults to unknown. |
source_version | Version of the source workload. Defaults to unknown. |
source_cluster | Cluster of the source workload. |
source_canonical_service | Canonical service of the source workload. |
source_canonical_revision | Canonical revision of the source workload. |
destination_namespace | Namespace of the destination workload. Defaults to unknown. |
destination_workload | Name of the destination workload. Defaults to unknown. |
destination_workload_namespace | Namespace of the destination workload. Defaults to unknown. |
destination_principal | Peer principal of the traffic destination. Populated only when peer authentication is configured. |
destination_app | Destination application, identified by the app label on the destination workload. Defaults to unknown. |
destination_version | Version of the destination workload. Defaults to unknown. |
destination_service | Destination service host responsible for an incoming request. |
destination_service_name | Name of the destination service. |
destination_service_namespace | Namespace of the destination service. |
destination_port | Port of the destination service. |
destination_cluster | Cluster of the destination workload. |
destination_canonical_service | Canonical service of the destination workload. |
destination_canonical_revision | Canonical revision of the destination workload. |
request_protocol | Protocol of the request. |
request_operation | Requested operation. |
response_flags | Additional response or connection details from the proxy. |
grpc_response_status | gRPC response status code. |
connection_security_policy | Service authentication policy of the request. |
Customize metrics in the ASM console
The console workflow depends on your ASM instance version. Find the section that matches your version below.
ASM instances V1.17.2.35 or later
Starting from V1.17.2.35, metric customization is part of the unified observability settings. For details, see Configure observability settings.
ASM instances V1.15.3.65 to V1.17.2.35
ASM V1.15.3.65 introduced a redesigned Monitoring Metrics page (previously named Custom Metrics) that separates global and workload-level settings. To upgrade to this version, see Upgrade an ASM instance.
Enable or disable a global metric
Log on to the ASM console. In the left-side navigation pane, choose Service Mesh > Mesh Management.
On the Mesh Management page, click the name of the ASM instance. In the left-side navigation pane, choose Observability Management Center > Monitoring metrics.
Click the Metric Settings tab, then select the Global tab.
For the target metric, select or clear Enable in the CLIENT side indicator or SERVER side index column.
Click Save.
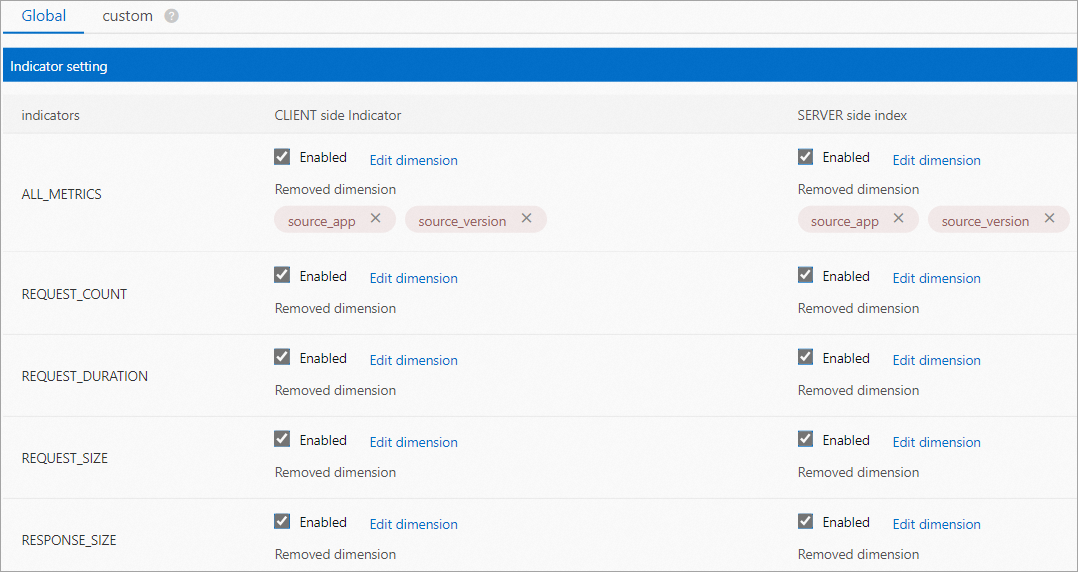
Modify dimensions for a global metric
On the Global tab, find the target metric and click Edit dimensions in the CLIENT side indicator or SERVER side index column.
In the Configure Custom CLIENT side dimension dialog box, select the dimensions to include, then click OK.
Click Save.
Create a custom metric for a specific workload
On the Metric Settings tab, click the custom tab, then click Create.
Configure the following parameters, then click Create at the bottom of the page.
| Parameter | Description |
|---|---|
| Namespace | The namespace where the custom metric takes effect. |
| Name | A name for the custom metric configuration. |
| Workload Selector | Click Add Match Label to specify the label name and value. ASM applies the custom metric only to workloads that match these labels. |
| Metric Settings | Enable or disable specific metrics, and modify their dimensions. For each metric, select or clear Enable in the CLIENT-side Metrics or SERVER-side Metrics column. Click Edit Dimensions to customize which tags are included. |
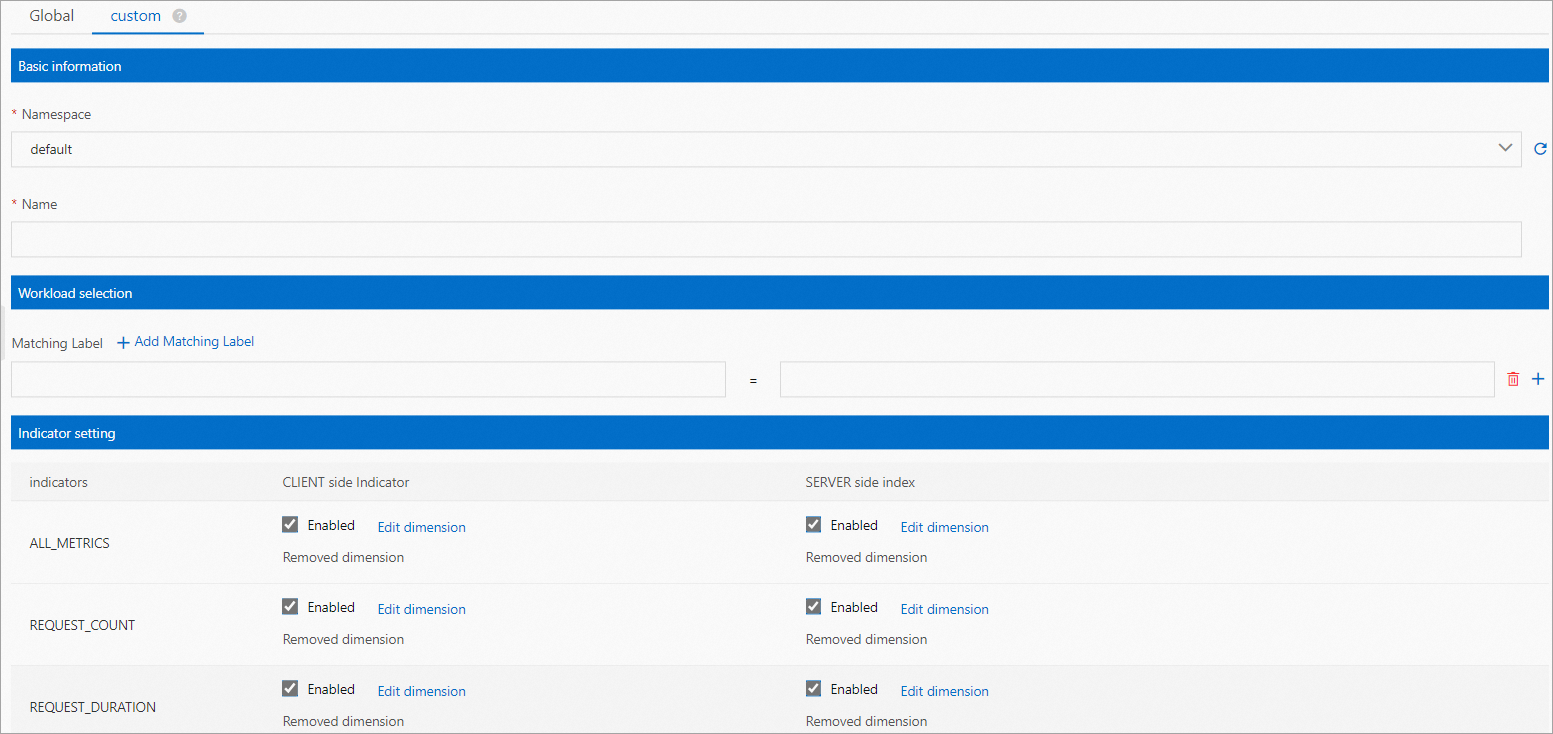
Use a workload selector to target a single workload within a namespace. The selector matches workloads by label.
In the same namespace, the following configurations are invalid:
Multiple custom metrics (Telemetry custom resources) that target the same workload with a selector.
Multiple custom metrics without a selector.
For more information, see Workload Selection.
ASM instances earlier than V1.15.3.65
Step 1: (Optional) Enable Prometheus monitoring
Skip this step if Prometheus monitoring is already enabled.
Log on to the ASM console. In the left-side navigation pane, choose Service Mesh > Mesh Management.
On the Mesh Management page, click the name of the ASM instance. In the left-side navigation pane, choose ASM Instance > Base Information.
On the Basic Information page, click Feature Settings in the upper-right corner.
In the Update Feature Settings panel, select Enable Prometheus Metric Collection, choose an enabling method as needed, then click OK.
Step 2: Create custom metrics
In the left-side navigation pane, choose Observability Management Center > Custom Metrics, then click Create.
On the Create page, configure the parameters described in the following table, then click Create.
| Parameter | Description |
|---|---|
| Match Labels | Set Name to the tag name and Value to the application name. ASM matches workloads based on these labels. The custom metrics take effect only on matching workloads. |
| inboundSidecar | Click inboundSidecar, then click Add Metric to configure custom tags for inbound traffic. Set Metric Name (leave blank to apply to all metrics), add dimensions with Add Metric Dimension (configure Tag and Expression), and specify Tags To Remove for any tags to exclude. |
| outboundSidecar | Click outboundSidecar, then click Add Metric to configure custom tags for outbound traffic. The parameters are the same as inboundSidecar. |
| gateway | Click gateway, then click Add Metric to configure custom tags for gateway traffic. The parameters are the same as inboundSidecar. |
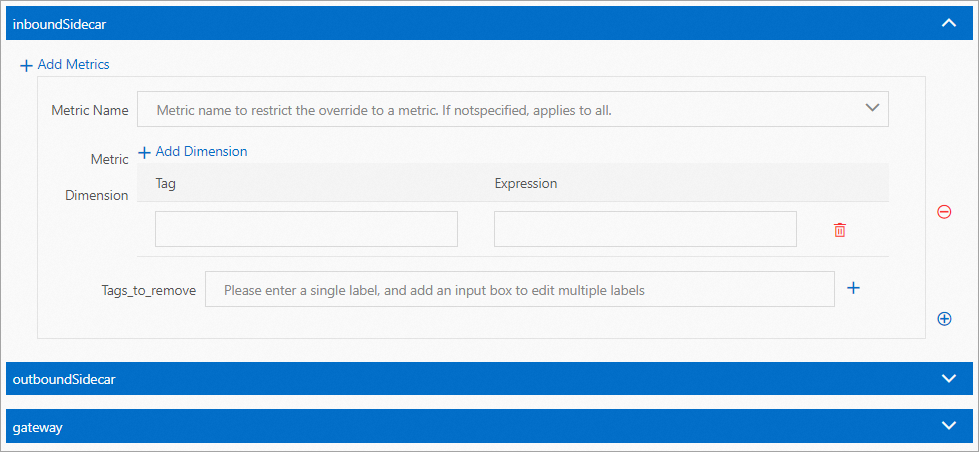
If you configure only inboundSidecar and leave outboundSidecar and gateway unconfigured, custom tags apply only to inbound traffic. Outbound and gateway metrics continue to use default tags.
Metric identifier reference
The following table maps ASM metric identifiers to their Prometheus metric names. Use these identifiers when you configure metrics through the Telemetry API or the ASM console. For more information, see MetricSelector.IstioMetric.
| Metric identifier | Description | Prometheus metric |
|---|---|---|
| ALL_METRICS | All default Istio metrics. | -- |
| REQUEST_COUNT | HTTP, HTTP/2, and gRPC request counter. | istio_requests_total |
| REQUEST_DURATION | HTTP, HTTP/2, and gRPC request duration histogram. | istio_request_duration_milliseconds |
| REQUEST_SIZE | HTTP, HTTP/2, and gRPC request body size histogram. | istio_request_bytes |
| RESPONSE_SIZE | HTTP, HTTP/2, and gRPC response body size histogram. | istio_response_bytes |
| TCP_OPENED_CONNECTIONS | TCP connections opened during a workload lifecycle. | istio_tcp_connections_opened_total |
| TCP_CLOSED_CONNECTIONS | TCP connections closed during a workload lifecycle. | istio_tcp_connections_closed_total |
| TCP_SENT_BYTES | Bytes sent during a response over a TCP connection. | istio_tcp_sent_bytes_total |
| TCP_RECEIVED_BYTES | Bytes received during a request over a TCP connection. | istio_tcp_received_bytes_total |
| GRPC_REQUEST_MESSAGES | gRPC messages sent from a client. | istio_request_messages_total |
| GRPC_RESPONSE_MESSAGES | gRPC messages sent from a server. | istio_response_messages_total |