Fluid is an open-source, Kubernetes-native distributed dataset orchestration and acceleration engine for data-intensive applications in cloud-native environments, such as big data and AI. Fluid provides a unified dataset abstraction, extensible data engine plugins, automated data operations, general-purpose data acceleration, and runtime independence. Managed Service for Prometheus supports one-click installation of Fluid components and includes out-of-the-box monitoring dashboards. This topic explains how to use Managed Service for Prometheus to monitor Fluid.
Prerequisites
-
Managed Service for Prometheus is enabled for your ACK cluster or ACK Serverless cluster. For more information, see Managed Service for Prometheus.
-
The cloud-native AI suite is deployed, and Fluid data acceleration is enabled. For more information, see Deploy the cloud-native AI suite.
-
To use all features of the Fluid control plane dashboard, ensure that ack-fluid version 0.9.7 or later is running in the cluster.
-
To use all features of the Fluid JindoRuntime cache system dashboard, ensure that ack-fluid version 1.0.11 or later is running in the cluster.
-
Limitations
The cache system dashboard can only monitor JindoRuntime cache runtime components (which use the JindoCache cache engine).
Step 1: Integrate Fluid
-
Log on to the ARMS console.
-
In the left navigation pane, click integration center. In the artificial intelligence section, click the Fluid card.
-
On the Fluid page, in the select container service cluster section, select the target cluster. If the Fluid component is already installed, you do not need to reinstall it.
-
In the Configuration Information section, set the parameters and click OK.
Parameter
Description
integration name (optional)
A unique name for the Fluid monitoring instance. You can leave this field blank.
metric collection interval (s)
The interval for collecting metrics.
-
You can view the integrated components on the integration management page in the ARMS console.
-
Log on to ARMS console.
-
In the left navigation pane, click integration management. On the integrated components tab, click the Fluid card.
-
On the environment list tab, click View Details in the Actions column for the target cluster to view details such as the Fluid component and dashboard alert rules.
-
Step 2: View Fluid dashboards
ACK console
Log on to the ACK console. In the left navigation pane, click Clusters.
-
On the Clusters page, click the ACK cluster or ACK Serverless cluster that contains the Fluid component. In the left-side navigation pane, choose .
-
On the Prometheus Monitoring page, choose to view the Fluid control plane dashboard.
The dashboard displays metrics from Prometheus Monitoring, including the running status of Fluid components, processing latency for the Fluid controller, QPS and latency for Fluid webhook requests, and the resource usage of each component. For more information, see Fluid monitoring dashboard parameters.
-
The Component Running Status section shows the number of ready pods, historical restart counts, and restart times for the Fluid control plane components.

-
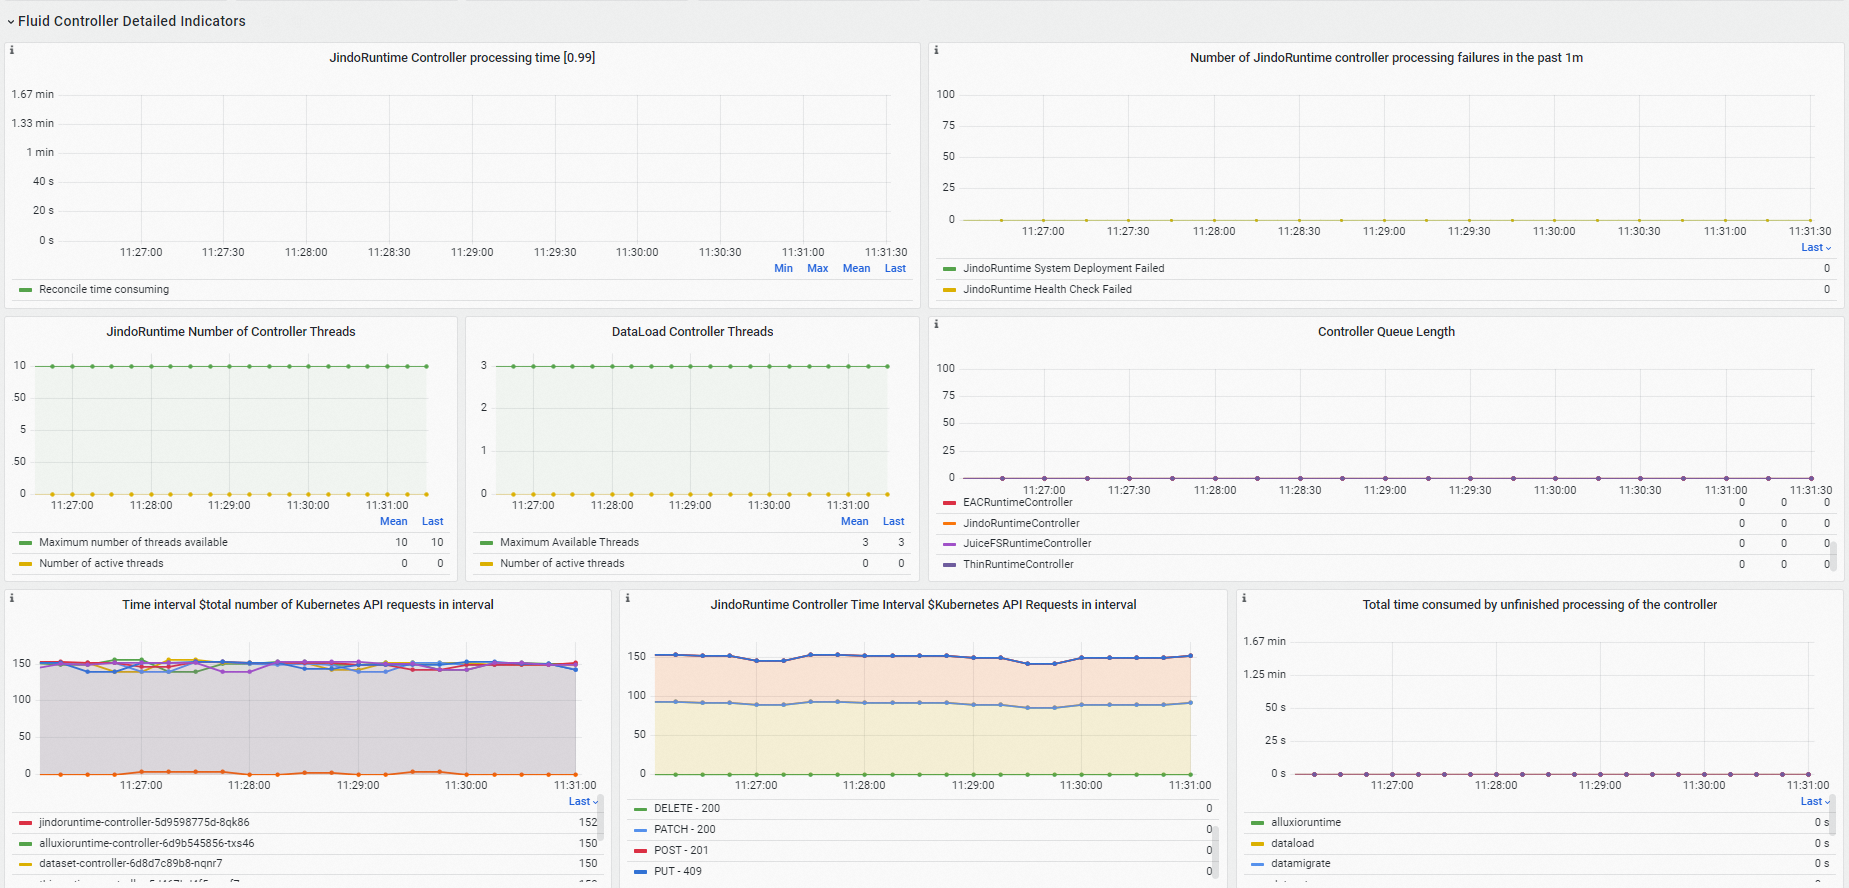
The Fluid Controller Detailed Metrics section shows the workload level, processing failures, and Kubernetes API requests of the Fluid controller component.
-
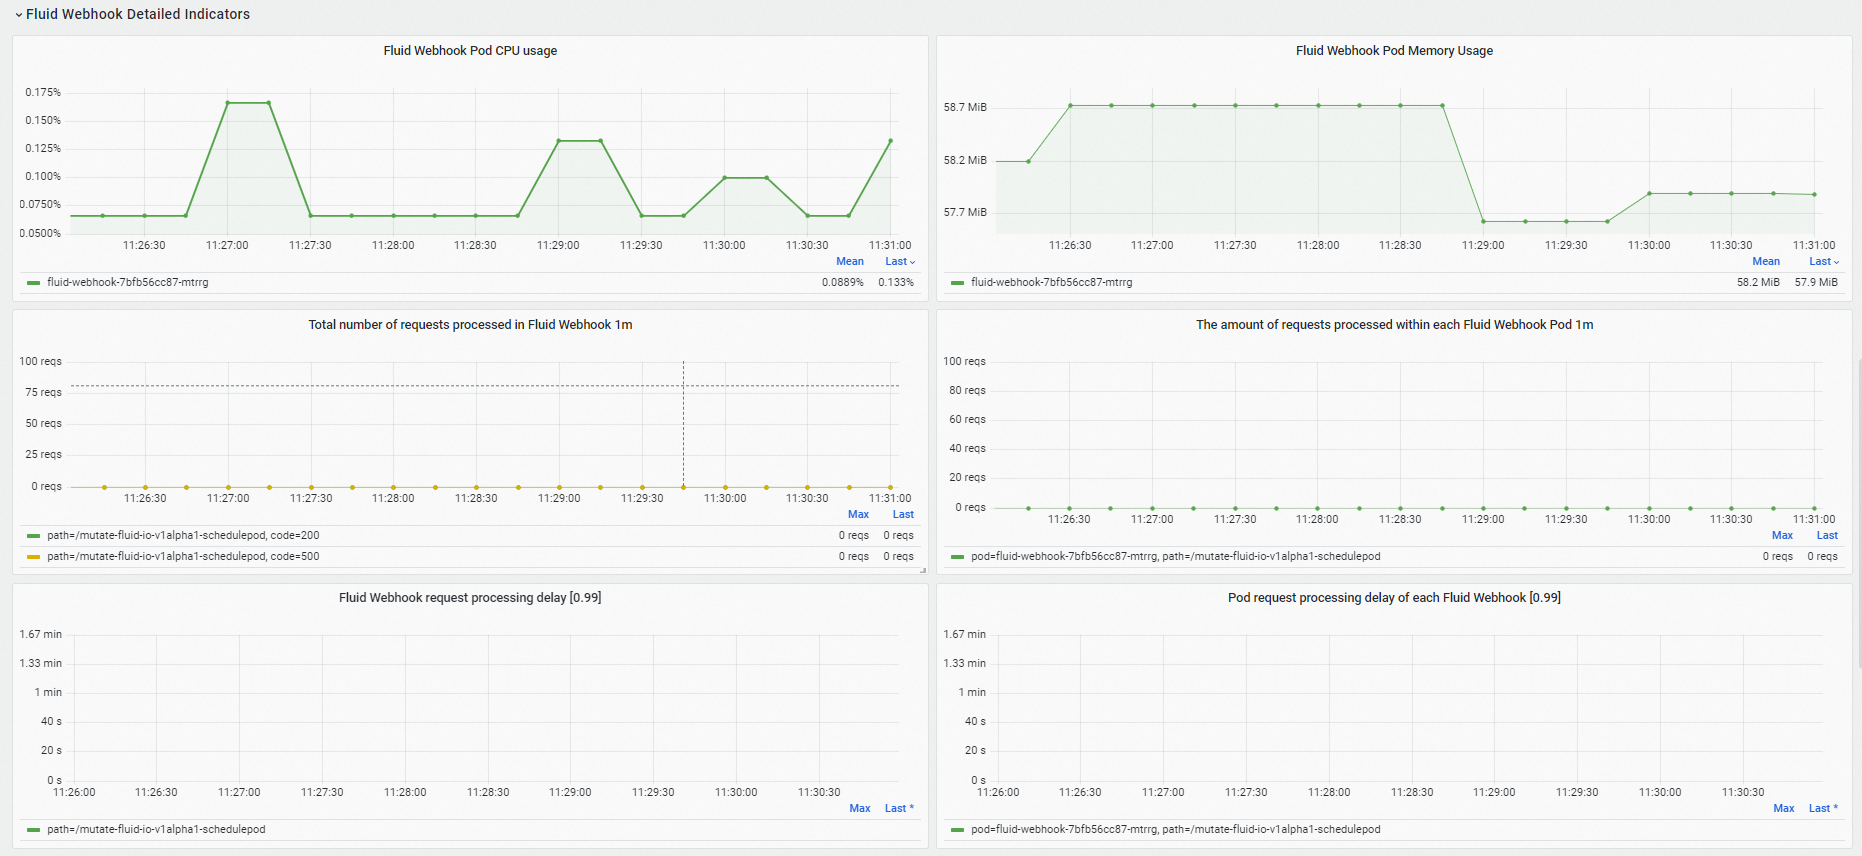
The Fluid Webhook Detailed Metrics section shows resource usage, the number of processed requests, and request processing latency for the Fluid webhook component.
-
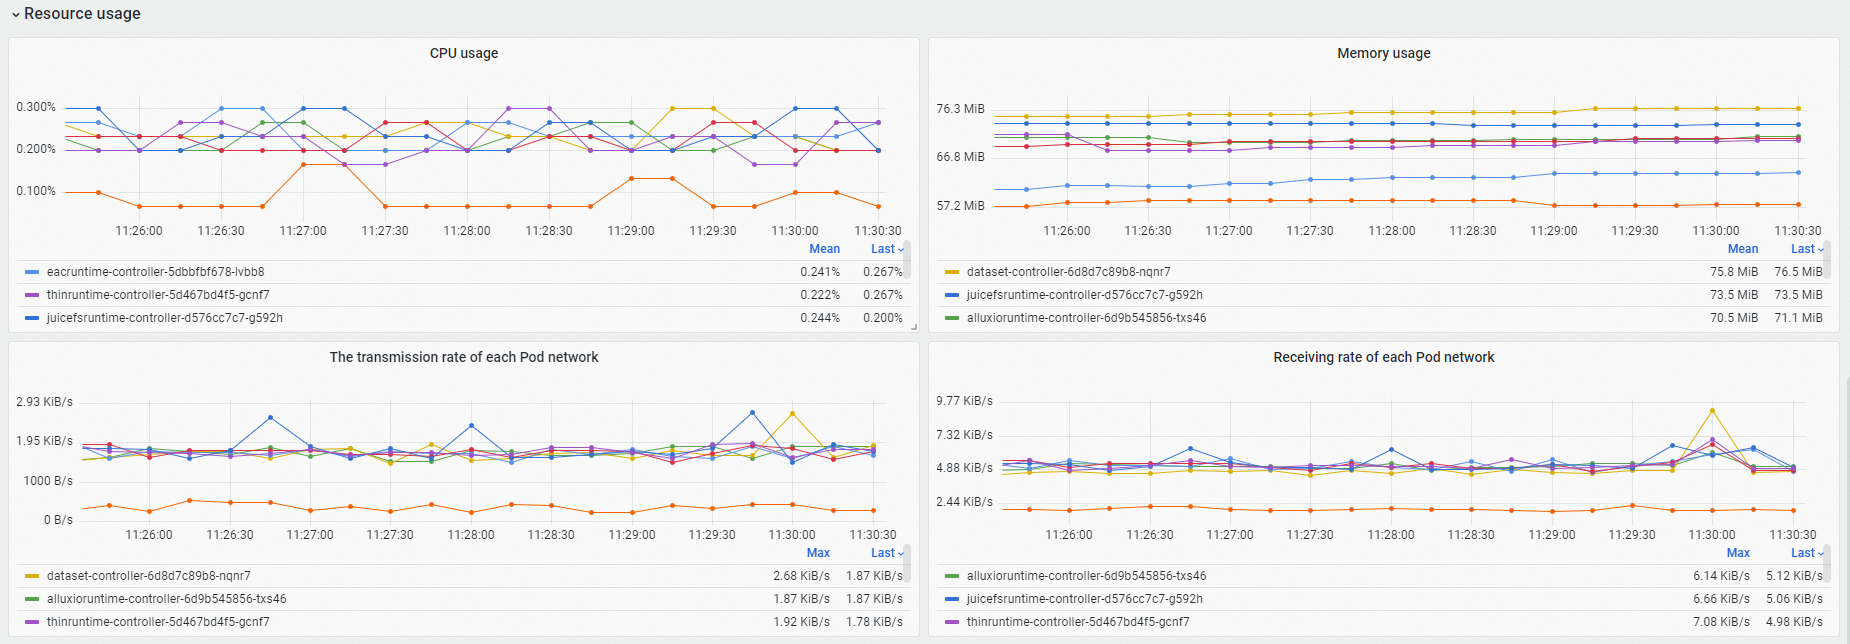
The Resource Usage section shows the resource usage and network traffic rates for all components of the Fluid control plane.
-
-
On the Prometheus Monitoring page, choose to view the Fluid JindoRuntime cache system dashboard.
The Fluid JindoRuntime cache system dashboard shows details about the Fluid JindoRuntime cache system. It includes a dataset overview, cache system metrics, and FUSE client metrics. For more information, see Fluid monitoring dashboard parameters.
-
The Dataset Overview section provides an overview of the selected Fluid dataset, including the number of running Master, Worker, and FUSE component pods in the cache system, as well as the resource configuration of each pod.

-
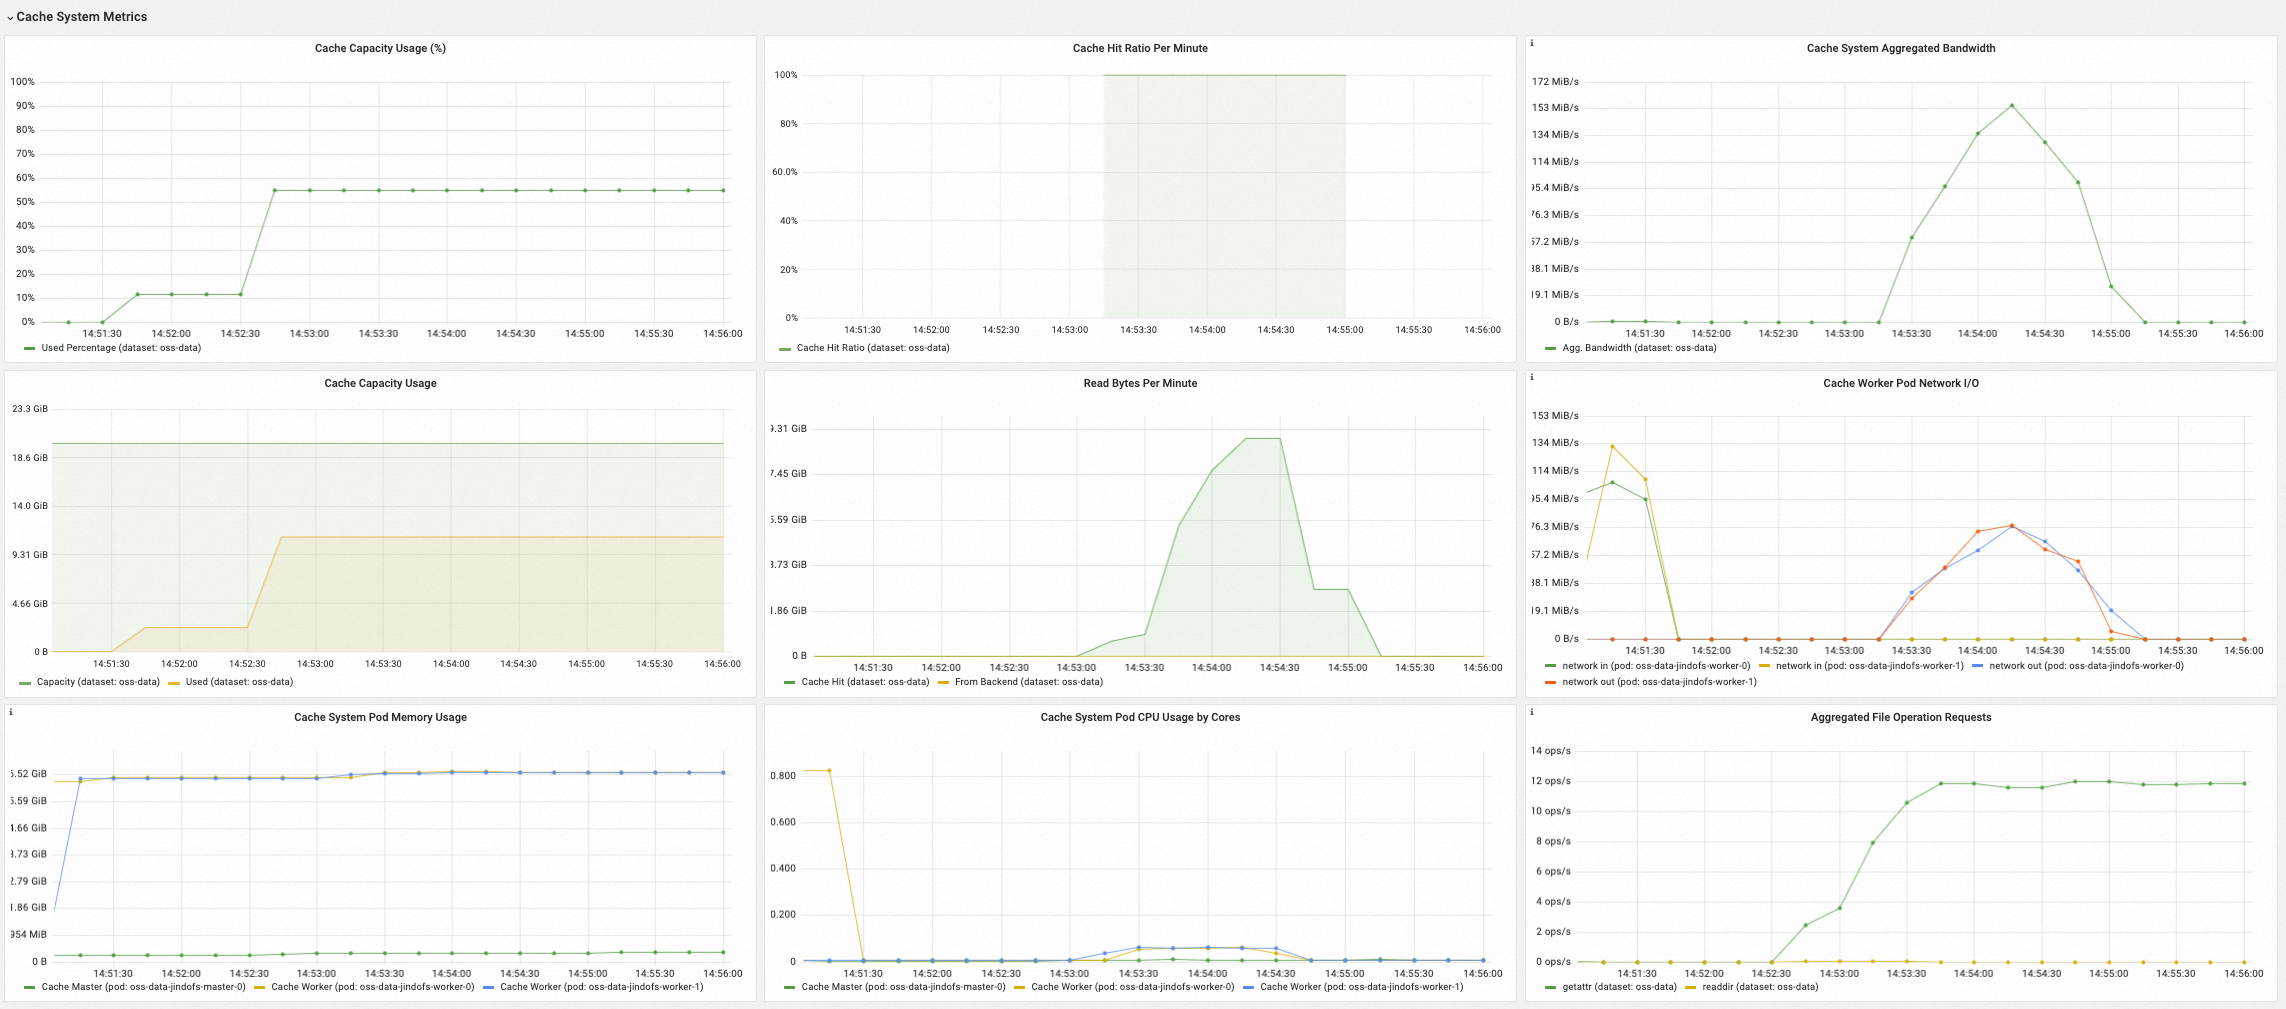
The Cache System Metrics section displays server-side metrics for the selected cache system, including used cache capacity, cache hit rate, aggregated bandwidth, and the QPS for metadata operations.
-
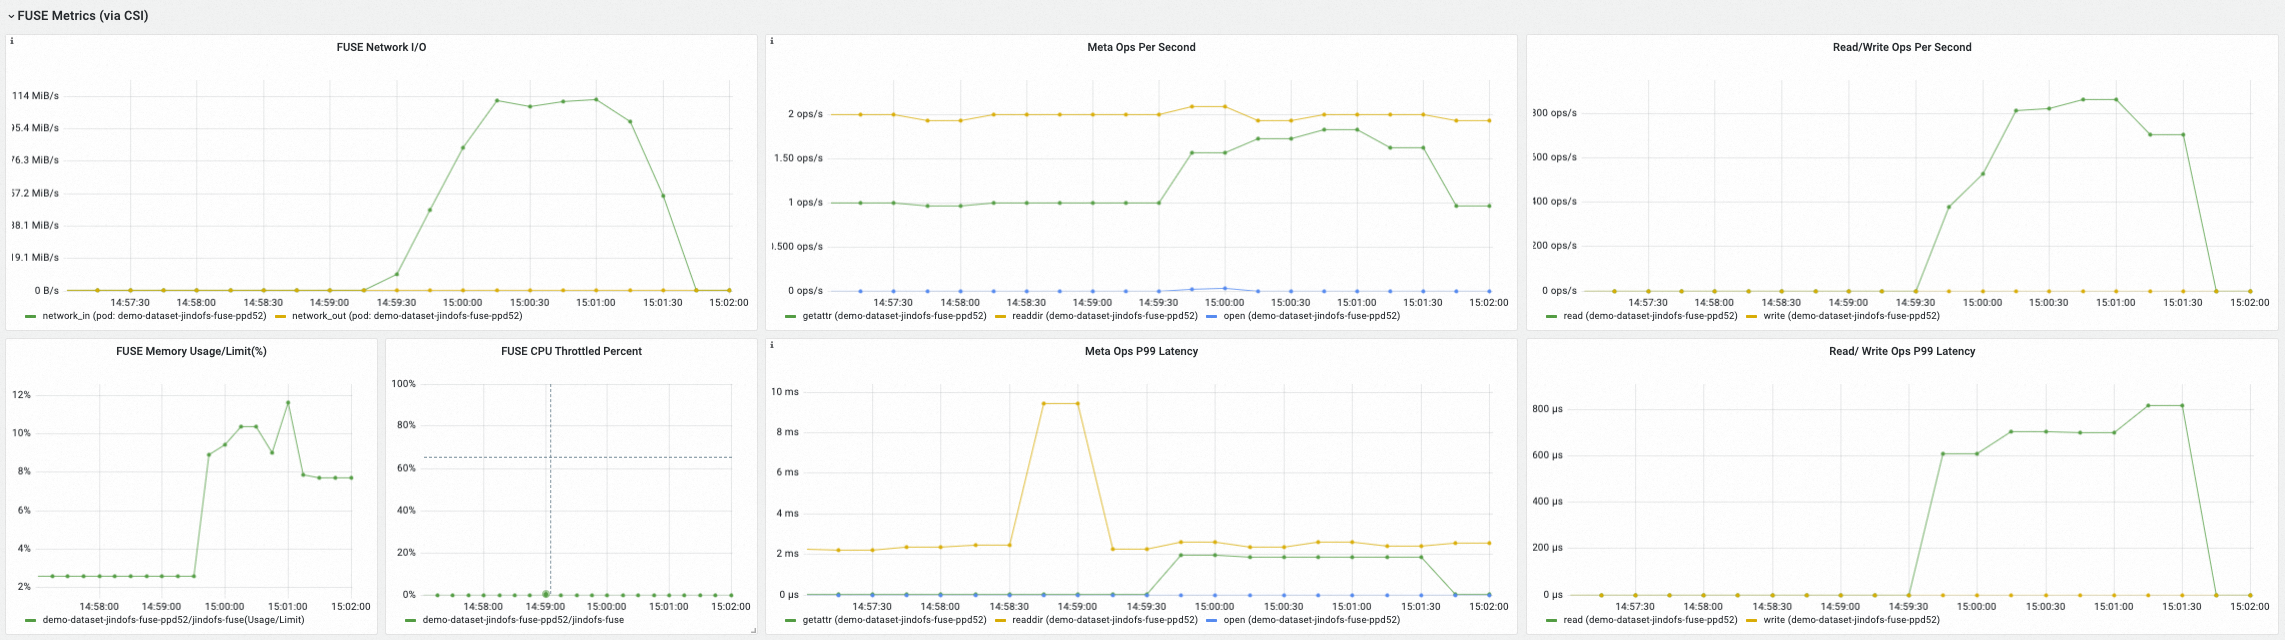
The FUSE Metrics (via CSI) section shows client-side metrics for FUSE file systems mounted with the Fluid CSI plugin in FUSE pods. Metrics include network I/O, metadata operation latency and QPS, and read/write operation latency and QPS for each FUSE pod.
-
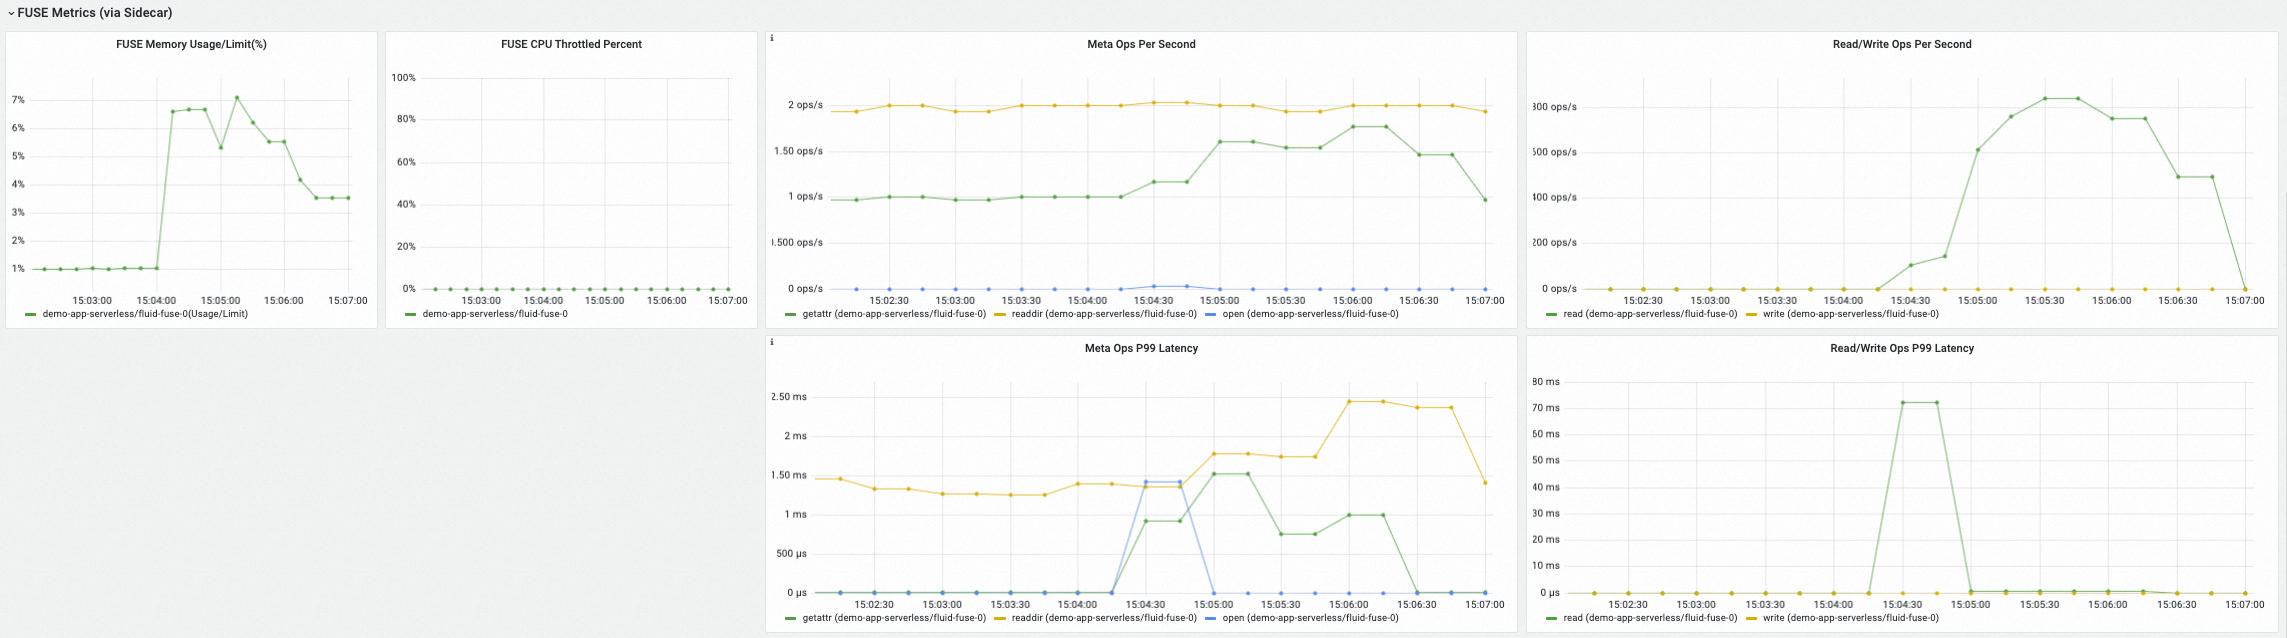
The FUSE Metrics (via Sidecar) section shows client-side metrics for FUSE file systems mounted in Fluid FUSE sidecar containers. These include metadata operation latency and QPS, and read/write operation latency and QPS.
-
ARMS console
-
Log on to the ARMS console.
-
In the left-side navigation pane, click Integration Center. In the Component Type section, select Fluid, click the Dashboard tab, and then click Fluid Control Plane at the bottom of the page to view the Fluid control plane dashboard.
The dashboard displays metrics from Prometheus Monitoring, including the running status of Fluid components, processing latency for the Fluid controller, QPS and latency for Fluid webhook requests, and the resource usage of each component. For more information, see Fluid monitoring dashboard parameters.
-
The Component Running Status section shows the number of ready pods, historical restart counts, and restart times for the Fluid control plane components.
-
The Fluid Controller Detailed Metrics section shows the workload level, processing failures, and Kubernetes API requests of the Fluid controller component.
-
The Fluid Webhook Detailed Metrics section shows resource usage, the number of processed requests, and request processing latency for the Fluid webhook component.
-
The Resource Usage section shows the resource usage and network traffic rates for all components of the Fluid control plane.
-
-
In the left-side navigation pane, click Integration Center. In the Component Type section, select Fluid, click the Dashboard tab, and then click Fluid JindoRuntime Dashboard at the bottom of the page to view the Fluid JindoRuntime cache system dashboard.
-
The Dataset Overview section provides an overview of the selected Fluid dataset, including the number of running Master, Worker, and FUSE component pods in the cache system, as well as the resource configuration of each pod.
-
The Cache System Metrics section displays server-side metrics for the selected cache system, including used cache capacity, cache hit rate, aggregated bandwidth, and the QPS for metadata operations.
-
The FUSE Metrics (via CSI) section shows client-side metrics for FUSE file systems mounted with the Fluid CSI plugin in FUSE pods. Metrics include network I/O, metadata operation latency and QPS, and read/write operation latency and QPS for each FUSE pod.
-
The FUSE Metrics (via Sidecar) section shows client-side metrics for FUSE file systems mounted in Fluid FUSE sidecar containers. These include metadata operation latency and QPS, and read/write operation latency and QPS.
-
Metrics
The following table lists the metrics used by the Fluid control plane components.
|
Metric |
Type |
Description |
|
dataset_ufs_total_size |
Gauge |
The total size of datasets mounted by active Dataset resources in the cluster. |
|
dataset_ufs_file_num |
Gauge |
The number of files in datasets mounted by active Dataset resources in the cluster. |
|
runtime_setup_error_total |
Counter |
The total number of failed runtime setup operations during controller reconciliation. |
|
runtime_sync_healthcheck_error_total |
Counter |
The total number of failed runtime health check operations during controller reconciliation. |
|
controller_runtime_reconcile_time_seconds_bucket |
Histogram |
The duration of the controller reconciliation loop. |
|
controller_runtime_reconcile_errors_total |
Counter |
The total number of controller reconciliation failures. |
|
controller_runtime_reconcile_total |
Counter |
The total number of completed controller reconciliation loops. |
|
controller_runtime_max_concurrent_reconciles |
Gauge |
The maximum number of available reconciliation coroutines in the controller. |
|
controller_runtime_active_workers |
Gauge |
The number of currently active reconciliation coroutines in the controller. |
|
workqueue_adds_total |
Counter |
The total number of add events processed by the controller's workqueue. |
|
workqueue_depth |
Gauge |
The current depth of the controller's workqueue. |
|
workqueue_queue_duration_seconds_bucket |
Histogram |
The time an item spends waiting in the controller's workqueue before being processed. |
|
workqueue_work_duration_seconds_bucket |
Histogram |
The distribution of time taken to process items from the workqueue. |
|
workqueue_unfinished_work_seconds |
Gauge |
The total duration of unfinished tasks currently being processed by the workqueue. |
|
workqueue_longest_running_processor_seconds |
Gauge |
The longest recorded processing time for a single task. |
|
rest_client_requests_total |
Counter |
The number of HTTP requests, broken down by status code, method, and host. |
|
rest_client_request_duration_seconds_bucket |
Histogram |
The latency of HTTP requests, broken down by verb and URL. |
|
controller_runtime_webhook_requests_in_flight |
Gauge |
The number of webhook requests currently being processed. |
|
controller_runtime_webhook_requests_total |
Counter |
The total number of requests processed by the webhook. |
|
controller_runtime_webhook_latency_seconds_bucket |
Histogram |
The latency of requests processed by the webhook. |
|
process_cpu_seconds_total |
Counter |
The total CPU time consumed by the process, in seconds. |
|
process_resident_memory_bytes |
Gauge |
The resident memory size of the process, in bytes. |
The following table lists the metrics exposed by the JindoCache server for the Fluid JindoRuntime cache dashboard.
|
Metric |
Type |
Description |
|
jindocache_server_total_stsnodes_num |
Gauge |
The number of active worker component replicas in the distributed cache. |
|
jindocache_server_total_disk_cap |
Gauge |
The maximum cache capacity for disk-based media (including RAM disks like tmpfs) in the distributed cache. |
|
jindocache_server_total_used_disk_cap |
Gauge |
The total used cache space on disk-based media (including RAM disks like tmpfs) in the distributed cache. |
|
jindocache_server_total_mem_cap |
Gauge |
The maximum cache capacity stored in process memory within the distributed cache. |
|
jindocache_server_total_used_mem_cap |
Gauge |
The total used cache space in process memory within the distributed cache. |
|
jindocache_server_total_used_rocksdb_cap |
Gauge |
The used RocksDB capacity in the distributed cache. |
|
jindocache_server_backend_read_bytes_total |
Gauge |
The total amount of data read from backend storage during origin fetches, in bytes. An origin fetch occurs when the requested data is not found in the JindoCache distributed cache and must be retrieved from the backend storage system. |
|
jindocache_server_backend_read_time_total |
Gauge |
The total time spent reading data from backend storage during origin fetches, in microseconds. |
|
jindocache_server_backend_readop_num_total |
Gauge |
The total number of read operations from backend storage during origin fetches. This count corresponds to the number of blocks in JindoCache. |
|
jindocache_server_backend_read_bytes_time_total_window |
Gauge |
The time spent reading data from backend storage during origin fetches within a one-minute window, in microseconds. |
|
jindocache_server_backend_read_bytes_total_window |
Gauge |
The total amount of data read from backend storage during origin fetches within a one-minute window, in bytes. |
|
jindocache_server_remote_read_bytes_total |
Gauge |
The total amount of data read from remote cache hits within the same cluster, in bytes. A remote cache hit occurs when the requested data is in the JindoCache distributed cache but on a different node from the application. |
|
jindocache_server_remote_read_time_total |
Gauge |
The total time spent on remote cache hit read operations within the same cluster, in microseconds. |
|
jindocache_server_remote_readop_num_total |
Gauge |
The total number of remote cache hit read operations within the same cluster. |
|
jindocache_server_remote_read_bytes_time_total_window |
Gauge |
The time spent on remote cache hit read operations within a one-minute window, in microseconds. |
|
jindocache_server_remote_read_bytes_total_window |
Gauge |
The total amount of data read from remote cache hits within a one-minute window, in bytes. |
|
jindocache_server_local_read_bytes_total |
Gauge |
The total amount of data read from local cache hits within the same cluster, in bytes. A local cache hit occurs when the requested data is in the JindoCache distributed cache on the same node as the application. |
|
jindocache_server_local_read_time_total |
Gauge |
The total time spent on local cache hit read operations within the same cluster, in microseconds. |
|
jindocache_server_local_readop_num_total |
Gauge |
The total number of local cache hit read operations within the same cluster. |
|
jindocache_server_local_read_bytes_time_total_window |
Gauge |
The time spent on local cache hit read operations within a one-minute window, in microseconds. |
|
jindocache_server_local_read_bytes_total_window |
Gauge |
The total amount of data read from local cache hits within a one-minute window, in bytes. |
|
jindocache_server_ns_filelet_op_count_total |
Gauge |
The total number of file metadata operations (including getAttr and listStatus) tracked by the JindoCache master component. |
|
jindocache_server_ns_filelet_op_time_total |
Gauge |
The total time spent processing file metadata operations (including getAttr and listStatus) by the JindoCache master component. |
|
jindocache_server_ns_get_attr_op_total |
Gauge |
The total number of getAttr operations tracked by the JindoCache master component. |
|
jindocache_server_ns_get_attr_time_total |
Gauge |
The total time spent processing getAttr operations by the JindoCache master component. |
|
jindocache_server_ns_get_attr_fallback_op_total |
Gauge |
The total number of times the JindoCache master component performed an origin fetch from backend storage to retrieve file metadata. |
|
jindocache_server_ns_list_status_op_total |
Gauge |
The total number of listStatus operations tracked by the JindoCache master component. |
|
jindocache_server_ns_list_status_time_total |
Gauge |
The total time spent processing listStatus operations by the JindoCache master component. |
|
jindocache_server_ns_list_status_fallback_op_total |
Gauge |
The total number of times the JindoCache master component performed an origin fetch to the backend storage system to retrieve a file list. |
|
jindocache_server_dist_get_attr_op_num_total |
Gauge |
The total number of getAttr operations tracked by the JindoCache client. |
|
jindocache_server_dist_get_attr_time_total |
Gauge |
The total time spent processing getAttr operations by the JindoCache client. |
|
jindocache_server_dist_list_dir_op_num_total |
Gauge |
The total number of list directory operations tracked by the JindoCache client. |
|
jindocache_server_dist_list_dir_time_total |
Gauge |
The total time spent processing list directory operations by the JindoCache client. |
The following table lists the metrics exposed by the JindoCache FUSE client for the Fluid JindoRuntime cache dashboard.
|
Metric |
Type |
Description |
|
jindo_fuse_open_count |
Gauge |
The number of open operations performed by the Jindo FUSE client. |
|
jindo_fuse_open_latency |
Gauge |
The P50 (50th percentile) latency of open operations for the Jindo FUSE client. |
|
jindo_fuse_open_latency_80 |
Gauge |
The P80 (80th percentile) latency of open operations for the Jindo FUSE client. |
|
jindo_fuse_open_latency_90 |
Gauge |
The P90 (90th percentile) latency of open operations for the Jindo FUSE client. |
|
jindo_fuse_open_latency_99 |
Gauge |
The P99 (99th percentile) latency of open operations for the Jindo FUSE client. |
|
jindo_fuse_open_latency_999 |
Gauge |
The P99.9 (99.9th percentile) latency of open operations for the Jindo FUSE client. |
|
jindo_fuse_open_latency_9999 |
Gauge |
The P99.99 (99.99th percentile) latency of open operations for the Jindo FUSE client. |
|
jindo_fuse_getattr_count |
Gauge |
The number of getAttr operations performed by the Jindo FUSE client. |
|
jindo_fuse_getattr_latency |
Gauge |
The P50 (50th percentile) latency of getAttr operations for the Jindo FUSE client. |
|
jindo_fuse_getattr_latency_80 |
Gauge |
The P80 (80th percentile) latency of getAttr operations for the Jindo FUSE client. |
|
jindo_fuse_getattr_latency_90 |
Gauge |
The P90 (90th percentile) latency of getAttr operations for the Jindo FUSE client. |
|
jindo_fuse_getattr_latency_99 |
Gauge |
The P99 (99th percentile) latency of getAttr operations for the Jindo FUSE client. |
|
jindo_fuse_getattr_latency_999 |
Gauge |
The P99.9 (99.9th percentile) latency of getAttr operations for the Jindo FUSE client. |
|
jindo_fuse_getattr_latency_9999 |
Gauge |
The P99.99 (99.99th percentile) latency of getAttr operations for the Jindo FUSE client. |
|
jindo_fuse_readdir_count |
Gauge |
The number of readdir operations performed by the Jindo FUSE client. |
|
jindo_fuse_readdir_latency |
Gauge |
The P50 (50th percentile) latency of readdir operations for the Jindo FUSE client. |
|
jindo_fuse_readdir_latency_80 |
Gauge |
The P80 (80th percentile) latency of readdir operations for the Jindo FUSE client. |
|
jindo_fuse_readdir_latency_90 |
Gauge |
The P90 (90th percentile) latency of readdir operations for the Jindo FUSE client. |
|
jindo_fuse_readdir_latency_99 |
Gauge |
The P99 (99th percentile) latency of readdir operations for the Jindo FUSE client. |
|
jindo_fuse_readdir_latency_999 |
Gauge |
The P99.9 (99.9th percentile) latency of readdir operations for the Jindo FUSE client. |
|
jindo_fuse_readdir_latency_9999 |
Gauge |
The P99.99 (99.99th percentile) latency of readdir operations for the Jindo FUSE client. |
|
jindo_fuse_read_count |
Gauge |
The number of read operations performed by the Jindo FUSE client. |
|
jindo_fuse_read_latency |
Gauge |
The P50 (50th percentile) latency of read operations for the Jindo FUSE client. |
|
jindo_fuse_read_latency_80 |
Gauge |
The P80 (80th percentile) latency of read operations for the Jindo FUSE client. |
|
jindo_fuse_read_latency_90 |
Gauge |
The P90 (90th percentile) latency of read operations for the Jindo FUSE client. |
|
jindo_fuse_read_latency_99 |
Gauge |
The P99 (99th percentile) latency of read operations for the Jindo FUSE client. |
|
jindo_fuse_read_latency_999 |
Gauge |
The P99.9 (99.9th percentile) latency of read operations for the Jindo FUSE client. |
|
jindo_fuse_read_latency_9999 |
Gauge |
The P99.99 (99.99th percentile) latency of read operations for the Jindo FUSE client. |
|
jindo_fuse_write_count |
Gauge |
The number of write operations performed by the Jindo FUSE client. |
|
jindo_fuse_write_latency |
Gauge |
The P50 (50th percentile) latency of write operations for the Jindo FUSE client. |
|
jindo_fuse_write_latency_80 |
Gauge |
The P80 (80th percentile) latency of write operations for the Jindo FUSE client. |
|
jindo_fuse_write_latency_90 |
Gauge |
The P90 (90th percentile) latency of write operations for the Jindo FUSE client. |
|
jindo_fuse_write_latency_99 |
Gauge |
The P99 (99th percentile) latency of write operations for the Jindo FUSE client. |
|
jindo_fuse_write_latency_999 |
Gauge |
The P99.9 (99.9th percentile) latency of write operations for the Jindo FUSE client. |
|
jindo_fuse_write_latency_9999 |
Gauge |
The P99.99 (99.99th percentile) latency of write operations for the Jindo FUSE client. |
References
-
For more information about Fluid, see Dataset.
-
For descriptions of the Fluid dashboard parameters, see Fluid dashboard parameter reference.