To detect anomalies, you can use a prediction and anomaly detection function to predict a time series curve as well as identify the Ksigma and quantiles of the errors between a predicted curve and an actual curve.
Function list
Function | Description |
Uses default parameters to model time series data and performs simple time series prediction and anomaly detection. | |
Uses an autoregressive model (AR) model to model time series data and performs simple time series prediction and anomaly detection. | |
Uses an autoregressive moving average (ARMA) model to model time series data and performs simple time series prediction and anomaly detection. | |
Uses an autoregressive integrated moving average (ARIMA) model to model time series data and performs simple time series prediction and anomaly detection. | |
Accurately predicts the trend for a periodic time series curve. Scenario: This function can be used to predict metering data, network traffic, financial data, and different business data that follows certain rules. | |
Filters the anomalies detected during anomaly detection on multiple time series curves based on the custom anomaly mode. This function helps you quickly find abnormal curves. |
ts_predicate_simple
Function format:
select ts_predicate_simple(x, y, nPred, isSmooth) The following table lists the parameters of the function format.
Parameter | Description | Value |
x | The time sequence. Points in time are sorted in ascending order along the horizontal axis. | Each point in time is a Unix timestamp. Unit: seconds. |
y | The sequence of numeric data corresponding to each specified point in time. | N/A. |
nPred | The number of points for prediction. | The value is of the long data type and must be equal to or greater than 1. |
isSmooth | Specifies whether to filter the raw data. | The value is of the Boolean data type. The default value is true, which indicates that the raw data is filtered. |
Example:
The query statement is as follows:
* | select ts_predicate_simple(stamp, value, 6) from (select ("__time__" - ("__time__" % 60)) as stamp, avg(v) as value from log GROUP BY stamp order by stamp)Output result
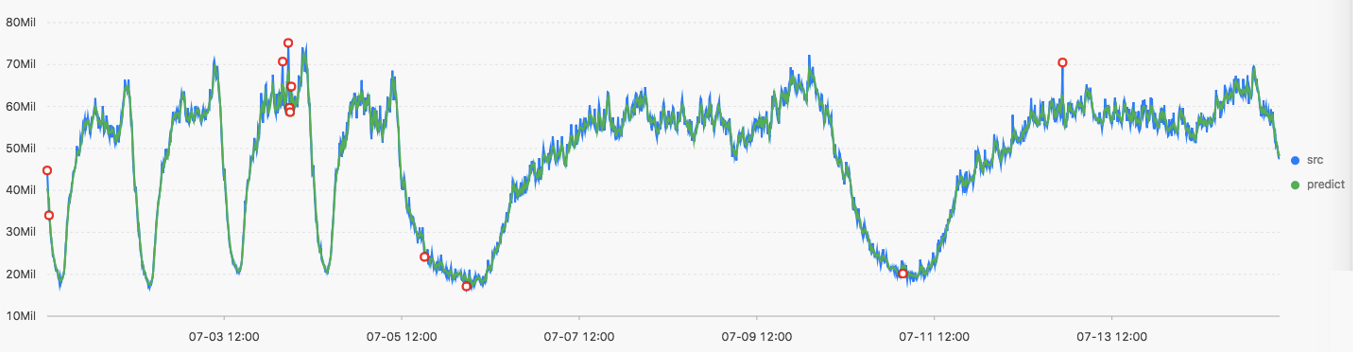
The following table lists the display items.
Display item | Description | |
Horizontal axis | unixtime | The Unix timestamp of the data. Unit: seconds. |
Vertical axis | src | The raw data. |
predict | The data generated after the filtering operation is performed. | |
upper | The upper limit of the confidence interval. The confidence level is 0.85, which cannot be modified. | |
lower | The lower limit of the confidence interval. The confidence level is 0.85, which cannot be modified. | |
anomaly_prob | The probability that the point is an anomaly. Valid values: [0, 1]. | |
ts_predicate_ar
Function format:
select ts_predicate_ar(x, y, p, nPred, isSmooth) The following table lists the parameters of the function format.
Parameter | Description | Value |
x | The time sequence. Points in time are sorted in ascending order along the horizontal axis. | Each point in time is a Unix timestamp. Unit: seconds. |
y | The sequence of numeric data corresponding to each specified point in time. | N/A. |
p | The order of the AR model. | The value is of the long data type. Valid values: 2, 3, 4, 5, 6, 7, and 8. |
nPred | The number of points for prediction. | The value is of the long data type. Valid values: [1, 5 × p]. |
isSmooth | Specifies whether to filter the raw data. | The value is of the Boolean data type. The default value is true, which indicates that the raw data is filtered. |
An example of the query statement is as follows:
* | select ts_predicate_ar(stamp, value, 3, 4) from (select ("__time__" - ("__time__" % 60)) as stamp, avg(v) as value from log GROUP BY stamp order by stamp)The output result is similar to that of the ts_predicate_simple function. For more information, see the output result of the ts_predicate_simple function.
ts_predicate_arma
Function format:
select ts_predicate_arma(x, y, p, q, nPred, isSmooth) The following table lists the parameters of the function format.
Parameter | Description | Value |
x | The time sequence. Points in time are sorted in ascending order along the horizontal axis. | Each point in time is a Unix timestamp. Unit: seconds. |
y | The sequence of numeric data corresponding to each specified point in time. | N/A. |
p | The order of the AR model. | The value is of the long data type. Valid values: [2, 100]. |
q | The order of the ARMA model. | The value is of the long data type. Valid values: 2, 3, 4, 5, 6, 7, and 8. |
nPred | The number of points for prediction. | The value is of the long data type. Valid values: [1, 5 × p]. |
isSmooth | Specifies whether to filter the raw data. | The value is of the Boolean data type. The default value is true, which indicates that the raw data is filtered. |
An example of the query statement is as follows:
* | select ts_predicate_arma(stamp, value, 3, 2, 4) from (select ("__time__" - ("__time__" % 60)) as stamp, avg(v) as value from log GROUP BY stamp order by stamp) The output result is similar to that of the ts_predicate_simple function. For more information, see the output result of the ts_predicate_simple function.
ts_predicate_arima
Function format:
select ts_predicate_arima(x, y, p, d, q, nPred, isSmooth) The following table lists the parameters of the function format.
Parameter | Description | Value |
x | The time sequence. Points in time are sorted in ascending order along the horizontal axis. | Each point in time is a Unix timestamp. Unit: seconds. |
y | The sequence of numeric data corresponding to each specified point in time. | N/A. |
p | The order of the AR model. | The value is of the long data type. Valid values: 2, 3, 4, 5, 6, 7, and 8. |
d | The order of the ARIMA model. | The value is of the long data type. Valid values: [1, 3]. |
q | The order of the ARMA model. | The value is of the long data type. Valid values: 2, 3, 4, 5, 6, 7, and 8. |
nPred | The number of points for prediction. | The value is of the long data type. Valid values: [1, 5 × p]. |
isSmooth | Specifies whether to filter the raw data. | The value is of the Boolean data type. The default value is true, which indicates that the raw data is filtered. |
An example of the query statement is as follows:
* | select ts_predicate_arima(stamp, value, 3, 1, 2, 4) from (select ("__time__" - ("__time__" % 60)) as stamp, avg(v) as value from log GROUP BY stamp order by stamp)The output result is similar to that of the ts_predicate_simple function. For more information, see the output result of the ts_predicate_simple function.
ts_regression_predict
Function format:
select ts_regression_predict(x, y, nPred, algotype,processType)The following table lists the parameters of the function format.
Parameter | Description | Value |
x | The time sequence. Points in time are sorted in ascending order along the horizontal axis. | Each point in time is a Unix timestamp. Unit: seconds. |
y | The sequence of numeric data corresponding to each specified point in time. | N/A. |
nPred | The number of points for prediction. | The value is of the long data type. Valid values: [1, 500]. |
algotype | The algorithm type for prediction. | Valid values:
|
processType | Specifies whether to preprocess the data. | Valid values:
|
Example:
The query statement is as follows:
* and h : nu2h05202.nu8 and m: NET | select ts_regression_predict(stamp, value, 200, 'origin') from (select ("__time__" - ("__time__" % 60)) as stamp, avg(v) as value from log group by stamp order by stamp)Output result
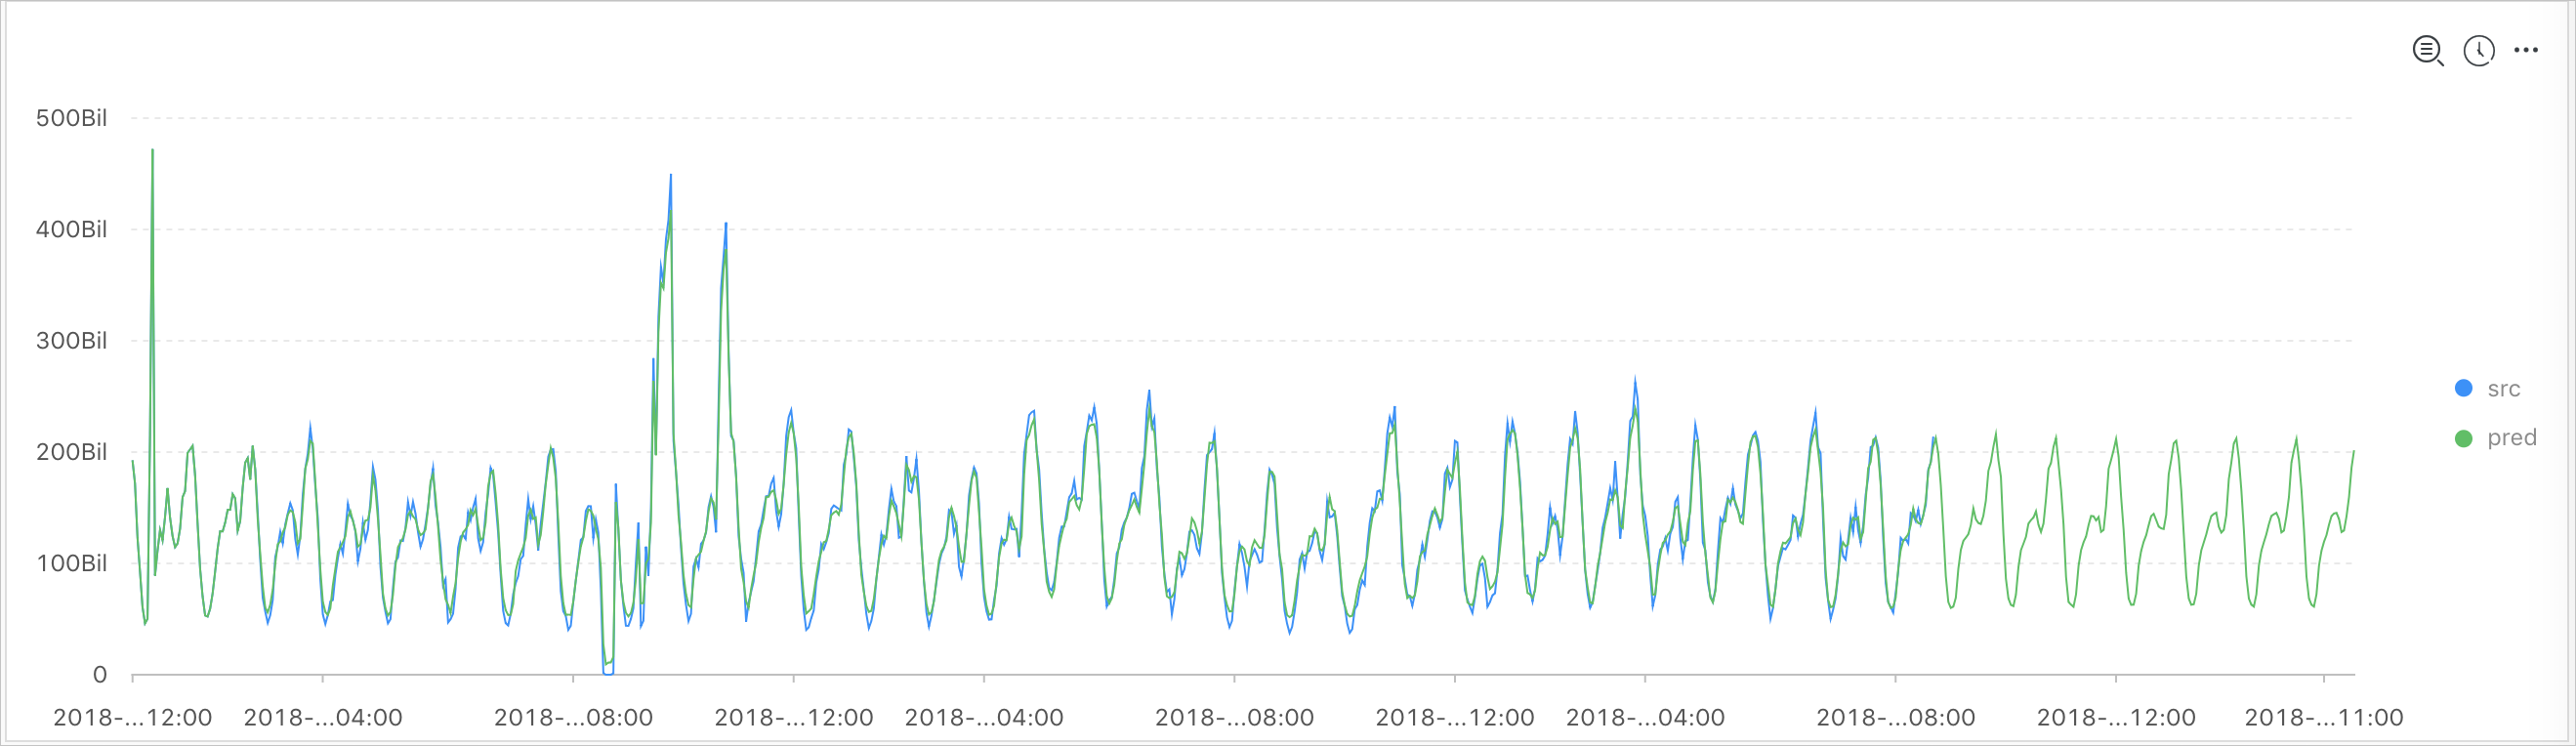
The following table lists the display items.
Display item | Description | |
Horizontal axis | unixtime | The Unix timestamp of the data. Unit: seconds. |
Vertical axis | src | The raw data. |
predict | The data generated after the filtering operation is performed. | |
ts_anomaly_filter
Function format:
select ts_anomaly_filter(lineName, ts, ds, preds, probs, nWatch, anomalyType)The following table lists the parameters of the function format.
Parameter | Description | Value |
lineName | The name of each curve. The value is of the varchar type. | N/A |
ts | The time sequence of the curve, which indicates the time on the current curve. The parameter value is an array of points in time of the double data type sorted in ascending order. | N/A |
ds | The actual value sequence of the curve. The parameter value is an array of data points of the double data type. This parameter value has the same length as the ts parameter value. | N/A |
preds | The predicted value sequence of the curve. The parameter value is an array of data points of the double data type. This parameter value has the same length as the ts parameter value. | N/A |
probs | The sequence of anomaly detection results of the curve. The parameter value is an array of data points of the double data type. This parameter value has the same length as the ts parameter value. | N/A |
nWatch | The number of the recently observed actual values on the curve. The value is of the long data type. The value must be smaller than the number of points in time on the curve. | N/A |
anomalyType | The type of the anomaly to filter. The value is of the long data type. | Valid values:
|
Example:
The query statement is as follows:
* | select res.name, res.ts, res.ds, res.preds, res.probs
     from (
         select ts_anomaly_filter(name, ts, ds, preds, probs, cast(5 as bigint), cast(1 as bigint)) as res
       from (
         select name, res[1] as ts, res[2] as ds, res[3] as preds, res[4] as uppers, res[5] as lowers, res[6] as probs
     from (
         select name, array_transpose(ts_predicate_ar(stamp, value, 10)) as res
         from (
           select name, stamp, value from log where name like '%asg-%') group by name)) );
Output result
| name                     | ts                                                   | ds          | preds     | probs       |
| ------------------------ | ---------------------------------------------------- | ----------- | --------- | ----------- |
| asg-bp1hylzdi2wx7civ0ivk | [1.5513696E9, 1.5513732E9, 1.5513768E9, 1.5513804E9] | [1,2,3,NaN] | [1,2,3,4] | [0,0,1,NaN] |