The Elastic High Performance Computing (E-HPC) optimizer is a performance monitoring and profiling platform. You can monitor cluster performance metrics, view cluster performance statistics, and analyze hot functions by process. You can optimize cluster performance based on the performance dashboard and performance data displayed by the E-HPC optimizer.
View the performance dashboard
Log on to the E-HPC console.
In the top navigation bar, select a region.
In the left-side navigation pane, choose E-HPC Tune.
On the ClusterView page, you can view the basic information and node heatmaps of your cluster.
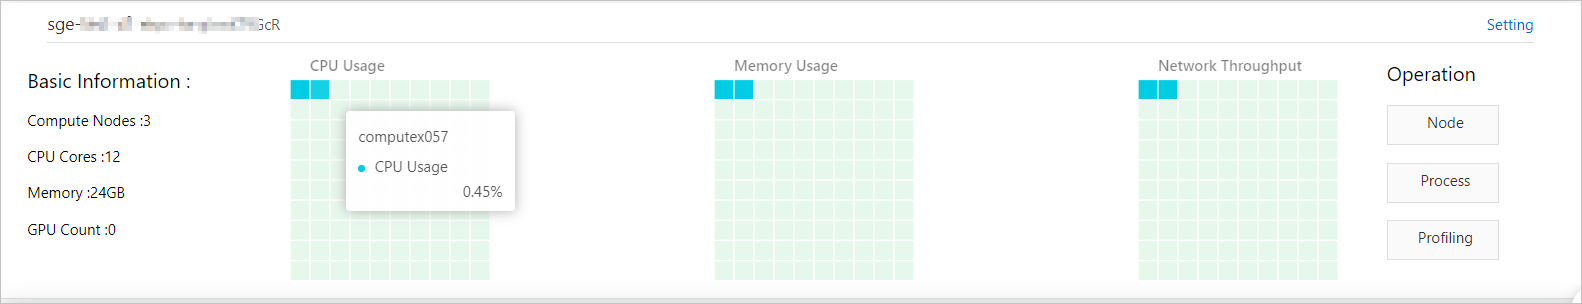
Each square block in a heatmap represents a node. If you move the pointer over a node, the name and performance metrics of the node are displayed, as shown in the preceding figure.
NoteThe heatmaps for CPU utilization, memory usage, network bandwidth, disk throughput, and disk usage are provided. To modify the heatmaps, click Setting in the upper-right corner. In the Dashboard Settings dialog box, you can specify the heatmaps based on your needs.
View node performance data
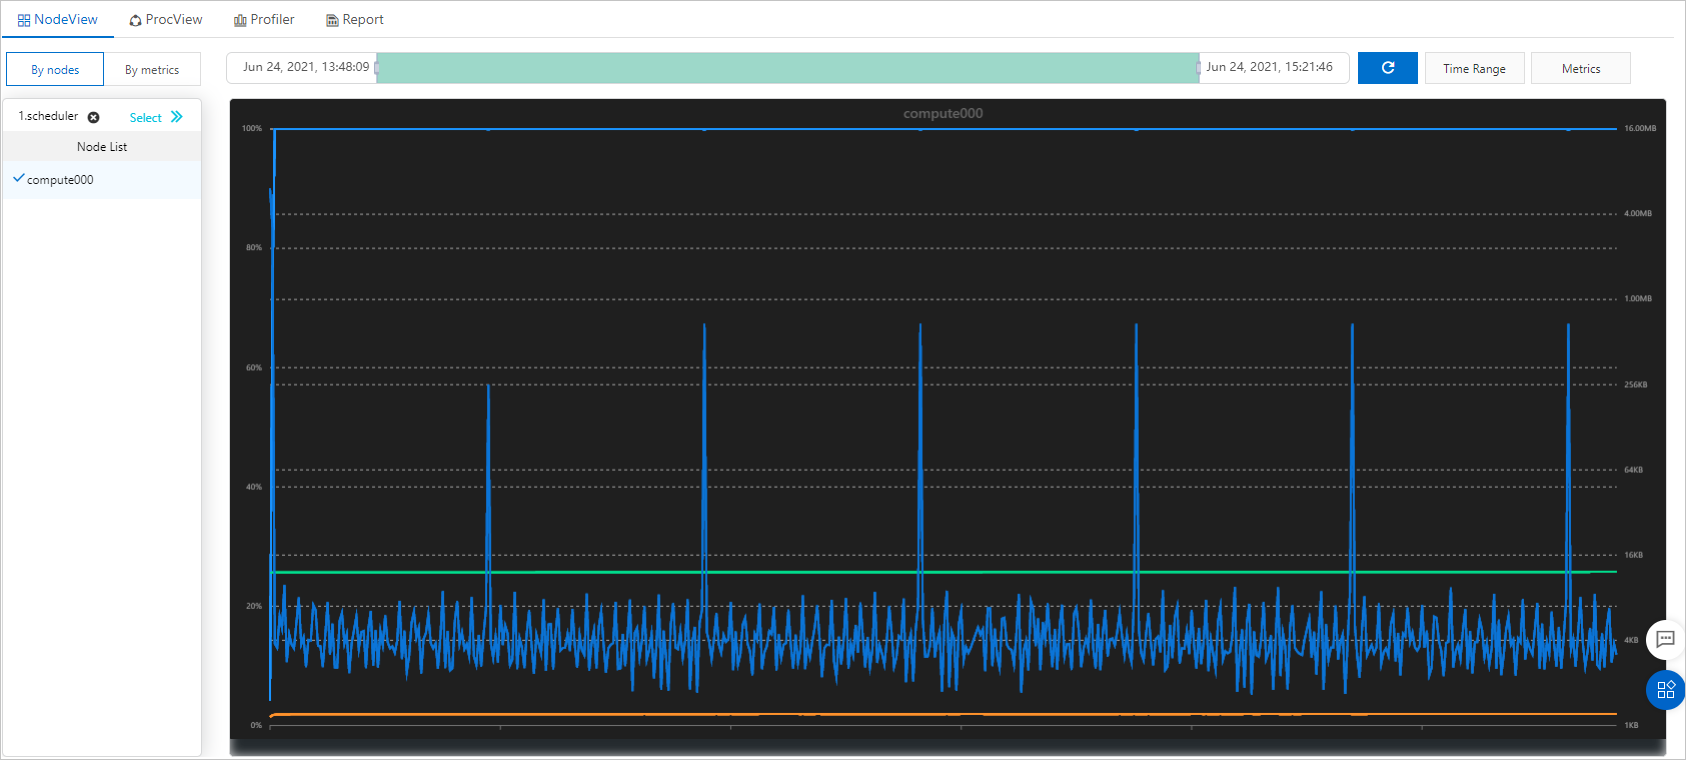
On the ClusterView page, select the cluster that you want to view and click Node in the Operation column.
In the Node List section, select the node whose performance data you want to view.
Optional. Click Select to view the node performance data of a specific job.
Drag the range slider to adjust the time range or click Time Range to select a time range.
Click Metrics and select the metrics that you want to view.
Select the dimension.
If you view node performance data by node, each subgraph shows the performance data of one node, and each curve indicates the data of one metric.
If you view node performance data by metric, each subgraph shows the performance data of one metric, and each curve indicates the data of one node.
View process performance data
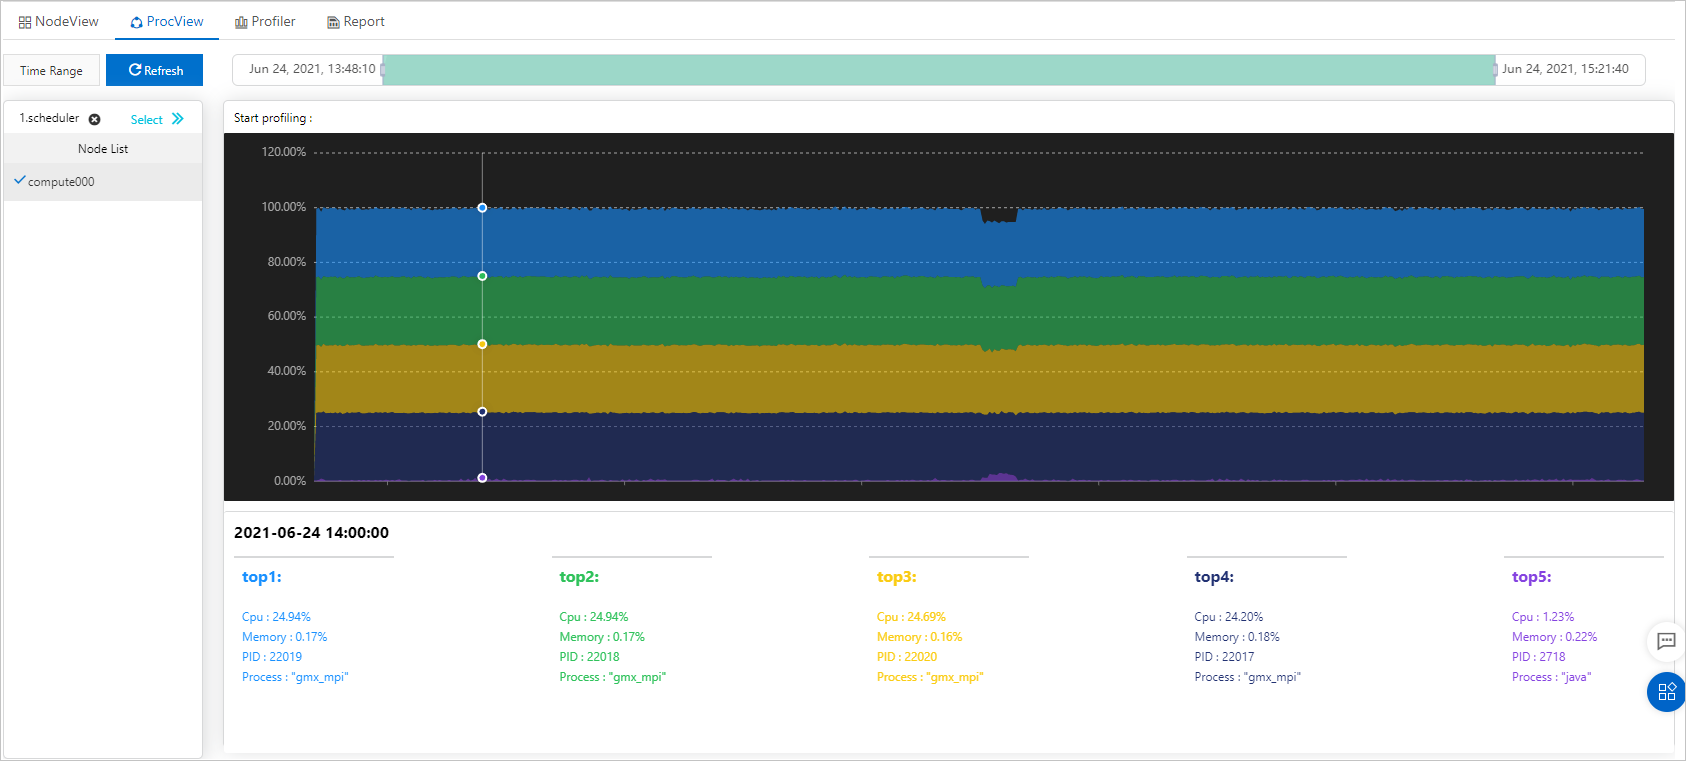
On the ClusterView page, select the cluster that you want to view and click Process in the Operation column.
In the Node List section, select the node that you want to view.
Optional. Click Select to view the process performance data of a specific job.
Drag the range slider to adjust the time range or click Time Range to select a time range.
The graph shows the top five processes that have the highest CPU utilization during the specified time range. To view the process details at a specific point in time, move the pointer over the graph.
Profile process performance data
On the ClusterView page, select the cluster that you want to view and click Process in the Operation column.
On the ProcView tab, select the process whose performance data you want to profile.
NoteThe top five processes that have the highest CPU utilization are displayed in the graph.
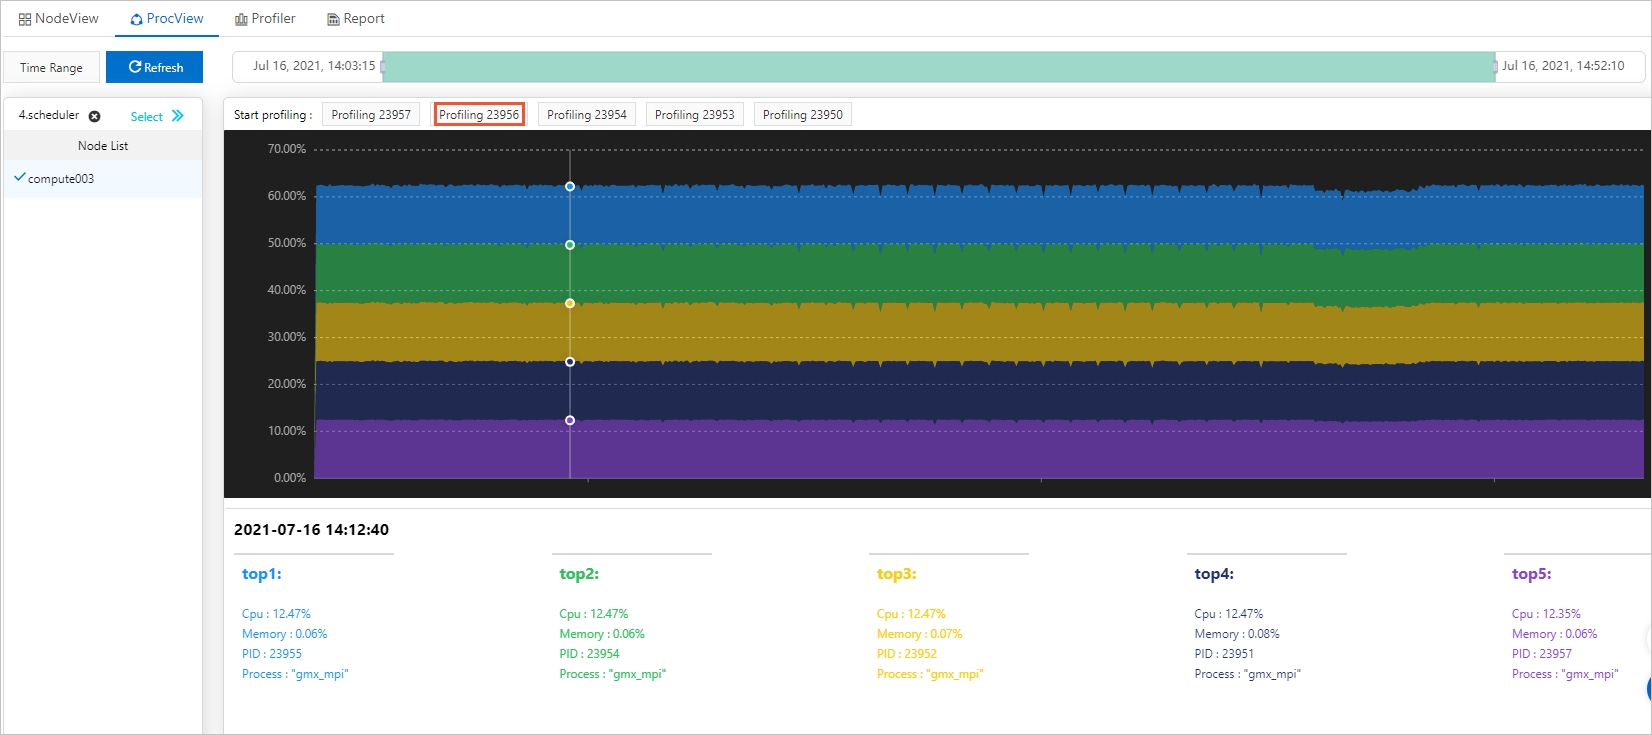
In the Profiling Settings dialog box, specify Duration and Frequency, and click OK.
On the Profiler tab, select the profiling result that you want to view and click View.
The flame graph of the performance profile is displayed on the Profiler tab. The flame graph visualizes CPU time spent on functions. This way, you can analyze hot functions.
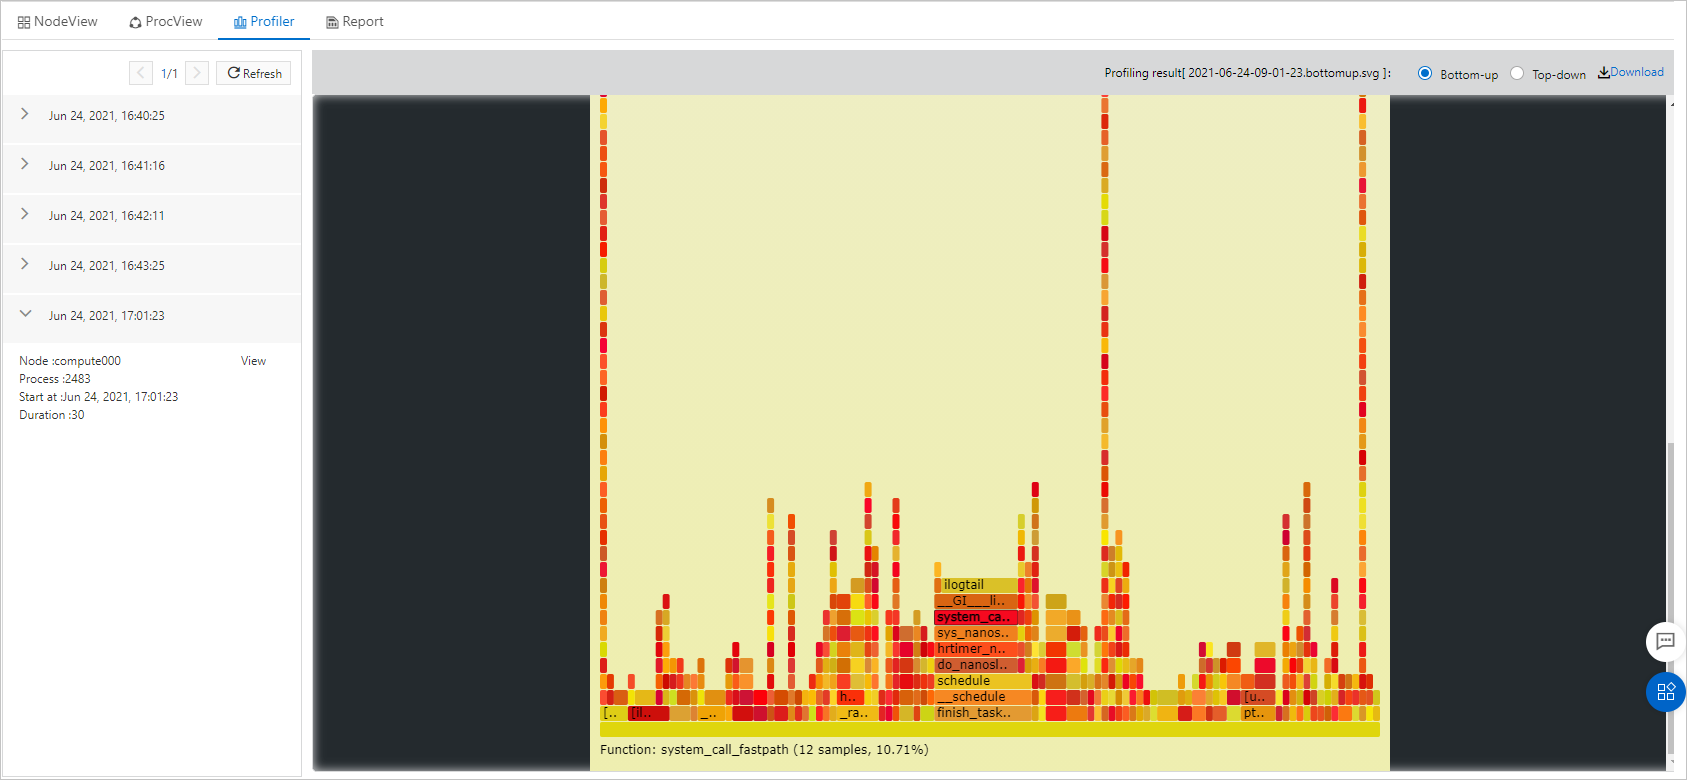
Optional. Click Download to download the profiling result.
You can optimize cluster performance based on the profiling result.