インターフェース監視機能は、アプリケーションのインターフェース呼び出しの詳細を監視するために使用されます。この機能を使用すると、SQL分析、NoSQL分析、例外分析、エラー分析、アップストリームおよびダウンストリームサービス、トレースを監視できます。
手順
インターフェース呼び出しページに移動するには、次の手順を実行します。
ARMS consoleにログオンします。左側のナビゲーションペインで、 を選択します。
アプリケーション一覧ページで、上部のナビゲーションバーでリージョンを選択し、管理するアプリケーションの名前をクリックします。
説明言語列に表示されるアイコンは、アプリケーションが記述されている言語を示します。
 :Javaアプリケーション
 :Goアプリケーション
 :Pythonアプリケーション
ハイフン(-):Managed Service for OpenTelemetryで監視されているアプリケーション。
左側のナビゲーションペインで、インターフェース呼び出しをクリックします。
フレームワーク
この機能は、次のWebフレームワークおよびリモートプロシージャコール(RPC)フレームワークで提供されるインターフェースを自動的に検出して監視できます。
Tomcat 7+
Jetty 8+
Resin 3.0+
Undertow 1.3+
WebLogic 11.0+
SpringBoot 1.3.0+
HSF 2.0+
Dubbo 2.5+
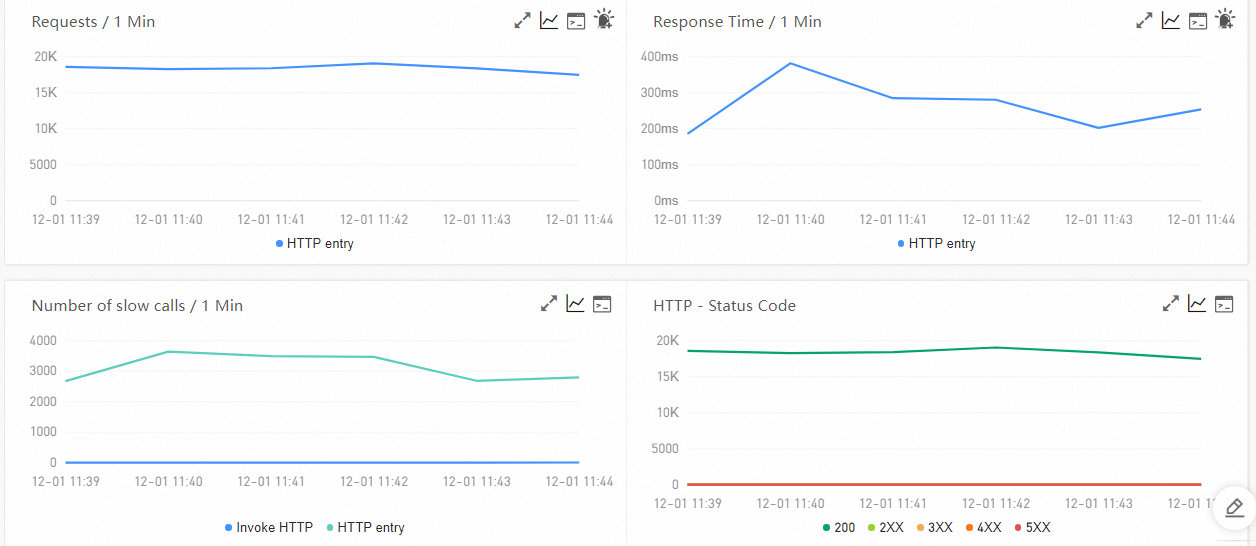
インターフェースの概要
概要タブでは、インターフェースの呼び出しトポロジの詳細と、リクエスト数、エラー数、応答時間、HTTPステータスコードに関する時系列曲線を表示できます。
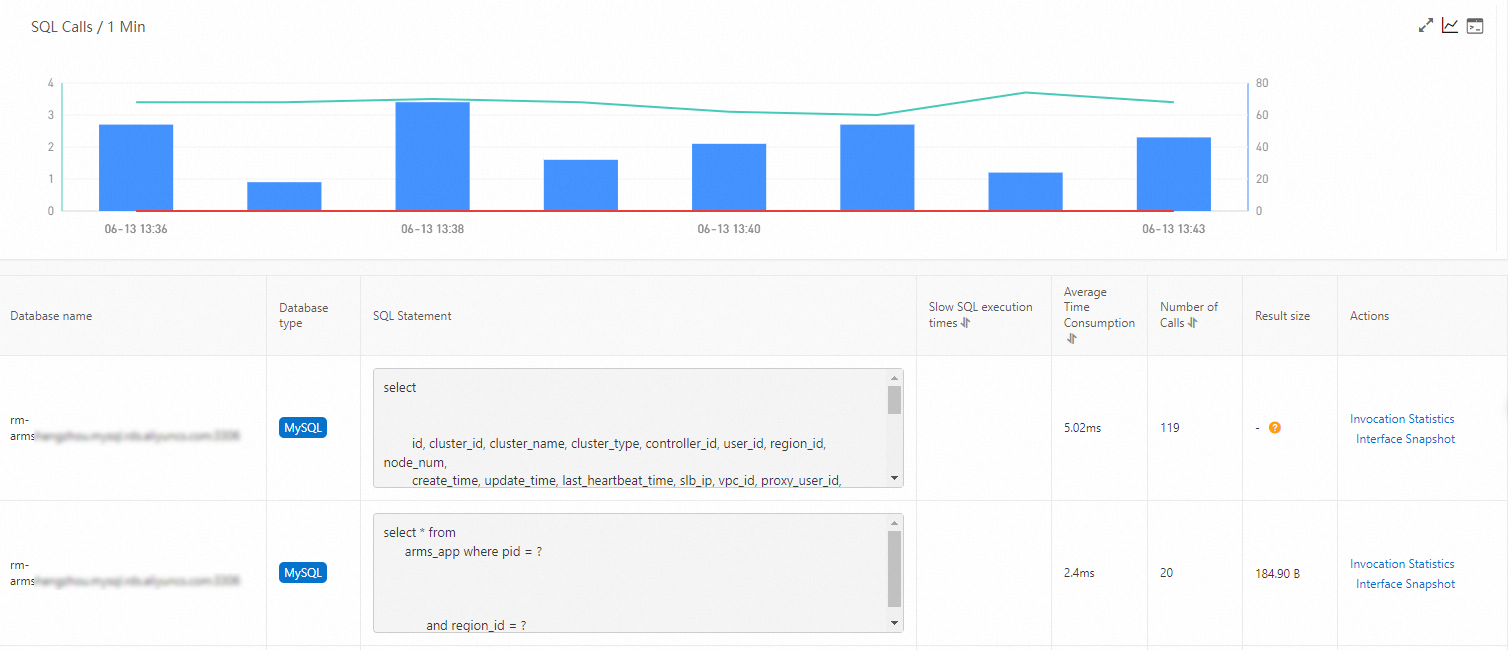
SQLおよびNoSQL分析
SQL分析タブとNosql分析タブでは、左側のペインで選択したインターフェースのコード内で開始されたSQLおよびNoSQLリクエストを表示できます。これらのタブでは、インターフェースの応答速度低下の原因となっている低速なSQLステートメントまたはNoSQLステートメントを特定できます。また、[アクション]列のインターフェーススナップショットをクリックして、SQLステートメントまたはNoSQLステートメントの実行ロジックが存在する完全なトレースを表示することもできます。詳細については、トレースの表示を参照してください。
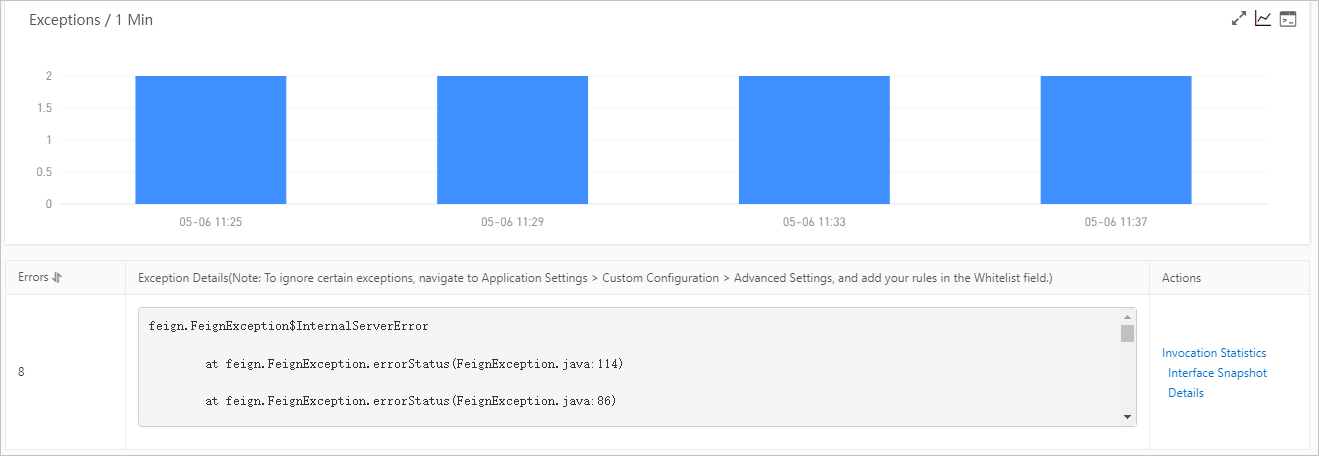
例外分析
例外分析タブには、左側のペインで選択したインターフェースのコードからスローされたJava例外が表示されます。また、[アクション]列のインターフェーススナップショットをクリックして、例外スタックが存在する完全なトレースを表示することもできます。詳細については、トレースの表示を参照してください。
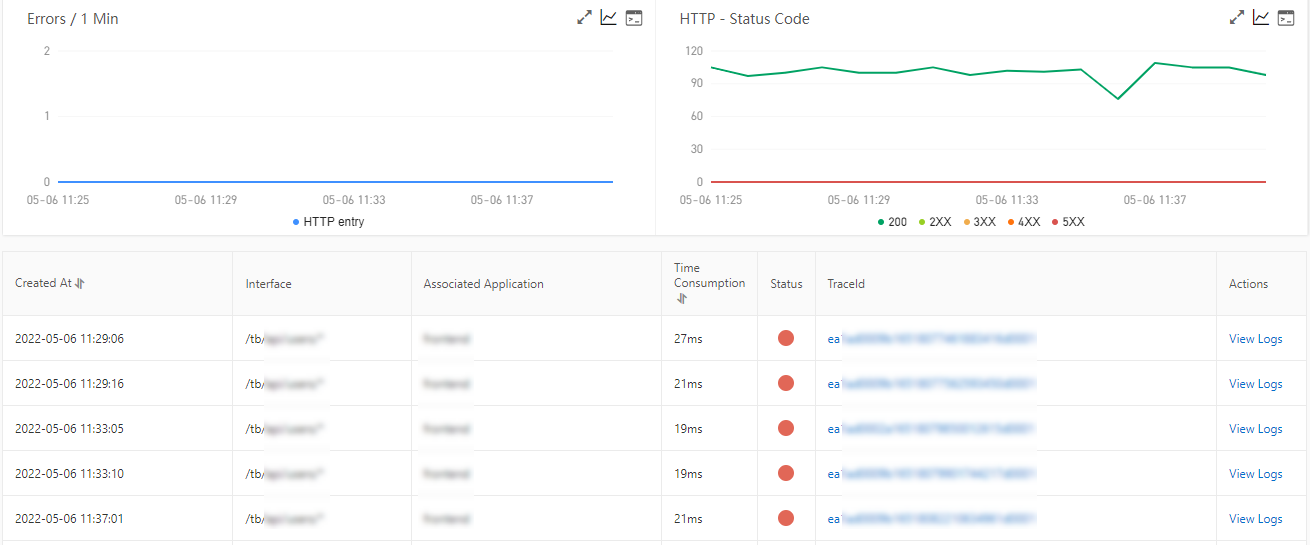
エラー分析
エラー分析タブでは、アプリケーションのエラーとHTTPステータスコードを表示できます。また、[TraceId]列の値をクリックして、新しいページにトレース情報を表示することもできます。詳細については、トレースの表示を参照してください。
アップストリームおよびダウンストリームサービスのインターフェース呼び出しの詳細を表示する
アップストリームサービスタブとダウンストリームサービスタブでは、アプリケーションを呼び出すアップストリームサービスと、アプリケーションによって呼び出されるダウンストリームサービスのインターフェースとパフォーマンスメトリクスを表示できます。パフォーマンスメトリクスには、応答時間、リクエスト数、エラー数が含まれます。

アップストリームトレースタブとダウンストリームトレースタブでは、ビジネス要件に基づいて次の操作を実行できます。
タブの上部にあるすべて展開/折りたたむをクリックして、すべてのインターフェースを表示または非表示にします。
検索ボックスにアプリケーション名またはインターフェース名のキーワードを入力し、検索アイコンをクリックして、名前にキーワードが含まれるインターフェースを検索します。
インターフェースのパフォーマンスメトリクスに関する情報を表示または非表示にする場合は、インターフェースを見つけて折りたたみパネルをクリックするか、行末にある上向き矢印または下向き矢印をクリックします。
トレースの表示
インターフェーススナップショットタブでは、選択したインターフェースのパラメータと、パラメータに基づいて生成された2つのチャートを表示できます。チャートには、インターフェース呼び出しの総数とインターフェース呼び出しのRTに関する統計が表示されます。

合計トレースチャートには、インターフェース呼び出しの総数と低速なインターフェース呼び出しの数が表示されます。インターフェース呼び出しのRTが500ミリ秒を超える場合、そのインターフェース呼び出しは低速なインターフェース呼び出しとして定義されます。しきい値はアプリケーション設定で構成できます。低速なインターフェース呼び出しの数には、非同期シナリオで生成されるローカルインターフェース呼び出しは含まれません。
インターフェース応答時間チャートには、RTの経時変化が表示されます。チャートは、インターフェース呼び出しの統計に基づいて生成され、指定したサンプリングレートの影響を受けます。
トレース詳細テーブルには、詳細なトレース情報が表示されます。[TraceId]列の値をクリックして、トレース情報を表示できます。詳細については、呼び出しリンク詳細を参照してください。
また、[アクション]列のログの表示をクリックして、インターフェース呼び出しのログを表示することもできます。
説明トレースIDをアプリケーションのビジネスログに関連付ける必要があります。こうすることで、アプリケーションでエラーが発生した場合、トレースIDに関連付けられているビジネスログにアクセスしてエラーをトラブルシューティングできます。詳細については、JavaアプリケーションのログにトレースIDを関連付けるを参照してください。