DataWorks Data Quality helps you ensure data quality by detecting changes in source data, tracking dirty data generated during the data extract, transform, and load (ETL) process, and automatically blocking the nodes that involve dirty data to stop the spread of dirty data to descendant nodes. This way, you can prevent nodes from producing unexpected dirty data that affects the smooth running of nodes and business decision-making. You can also minimize the waste of time, money, and resources, and ensure that your business always stays on the right track.
Billing
- Fees included in your DataWorks bills
You are charged by DataWorks based on the number of Data Quality checks. For more information, see Billing of Data Quality.
- Fees not included in your DataWorks bills
You are also charged by the compute engines that are associated with your DataWorks workspace. When monitoring rules are triggered, SQL statements are generated and executed on specific compute engines. In this case, you are charged for the computing resources provided by the compute engines. For more information, see the topic about billing for each type of compute engine. For example, you associate a MaxCompute project that is billed by using the pay-as-you-go billing method with your DataWorks workspace. In this case, you are charged for executing SQL statements and the fees are included in your MaxCompute bills instead of your DataWorks bills.
Features
Data Quality can check data quality of common big data storage systems, such as MaxCompute, E-MapReduce (EMR) Hive, and Hologres. Data Quality allows you to configure monitoring rules that focus on multiple dimensions of data, such as integrity, accuracy, validity, consistency, uniqueness, and timeliness. You can configure a monitoring rule for a specific table and associate the monitoring rule with a node that generates the table data. After the node is run, the monitoring rule is triggered to check the data generated by the node and reports data anomalies at the earliest opportunity. You can also configure a monitoring rule as a strong rule or a weak rule to determine whether to fail the associated node when Data Quality detects anomalies. This way, you can prevent dirty data from spreading downstream and minimize the waste of time and money on data restoration.
| Feature | Description |
|---|---|
| Overview | The Overview page provides an overview of alerts and blocks triggered by Data Quality checks for tables and topics in data sources of the current workspace. This page includes the following sections:
|
| My Subscriptions | The My Subscriptions page displays the monitoring rules that you subscribe to and are configured to send alert notifications by email only or by both email and text message. Data Quality supports the following notification methods: Email, Email and SMS, DingTalk Chatbot, Enterprise WeChat Chatbot, and Lark Group Chatbot. |
| Rule Configuration | You can configure monitoring rules by table on the Configure by Table page or by template on the Configure by Template page. For more information, see Configure monitoring rules by table (for a single table) and Configure monitoring rules based on a monitoring rule template. |
| Node Query | On the Node Query page, you can filter nodes by the table name, topic name, node ID, or node name. Then, you can view the historical check records and details of a specific node. |
| Mange noise reduction rules | On the Noise Reduction Management page, you can specify a date on which the detected abnormal data is denoised in the current workspace. Specifically, when abnormal data on the specified day is detected, Data Quality does not send alert notifications or block related nodes. |
| Report Template Management | On the Report Template Management page, you can configure report templates by selecting metrics that collect statistics on rule configuration and rule execution, specifying a statistical period, selecting a report frequency, and setting notification methods. Then, Data Quality generates and sends reports based on the template configurations. |
| Rule Templates | On the Rule Templates page, you can manage a set of custom rule templates and use the rule templates to improve the efficiency of rule configuration. |
Usage notes
- Before you configure monitoring rules for EMR, Hologres, AnalyticDB for PostgreSQL, and Cloudera's Distribution Including Apache Hadoop (CDH) tables, you must collect metadata from the EMR, Hologres, AnalyticDB for PostgreSQL, and CDH data sources. For more information about how to collect metadata, see the topics in Metadata collection.
- After monitoring rules are configured for EMR, Hologres, AnalyticDB for PostgreSQL, and CDH tables, the rules can be triggered only in the following condition: The nodes that generate the table data execute the monitoring rules by using exclusive resource groups for scheduling that are connected to the EMR, Hologres, AnalyticDB for PostgreSQL, and CDH data sources.
- You can configure multiple monitoring rules for a table.
Scenarios
To allow Data Quality to check offline data, you must configure a monitoring rule for a table by performing the following operations: Configure a partition filter expression for the table, create and configure a monitoring rule in which the partition filter expression is used for the table, and associate the monitoring rule with a node that generates the table data. After the node is run, the monitoring rule is triggered to check the data identified by the partition filter expression. To determine whether to fail the node when Data Quality detects anomalies, you can configure the monitoring rule as a strong rule or a weak rule. This way, you can prevent dirty data from spreading downstream. On the rule configuration page of the table, you can also specify notification methods to receive alert notifications at the earliest opportunity.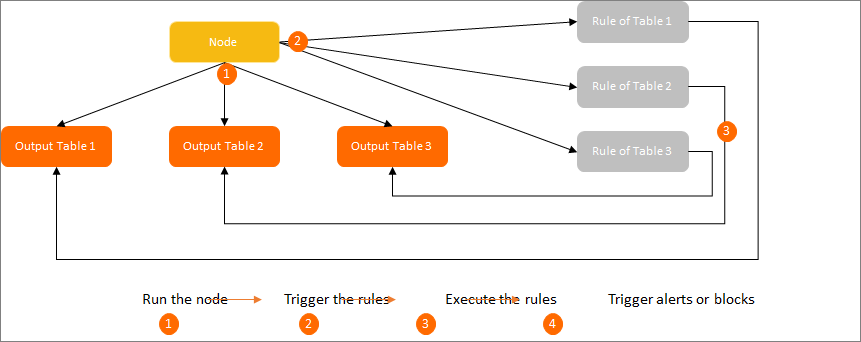
Configure a monitoring rule
- Create a monitoring rule: You can create a monitoring rule for a specific table. You can also create monitoring rules for multiple tables at a time by using a system template. For more information, see Configure monitoring rules by table and Configure monitoring rules based on a monitoring rule template.
- Subscribe to a monitoring rule: After a monitoring rule is created, you can subscribe to the monitoring rule to receive alert notifications of Data Quality checks by using the notification methods that you configure for the monitoring rule, such as Email, Email and SMS, DingTalk Chatbot, DingTalk Chatbot @ALL, Lark Group Chatbot, Enterprise WeChat Chatbot, and Custom Webhook. Note The Custom Webhook notification method is supported only in DataWorks Enterprise Edition.
Trigger the monitoring rule
You must associate a node with the monitoring rule to allow Data Quality to check the data quality of the node. When the node code is executed in Operation Center, the monitoring rule is triggered and transformed into an SQL statement to check the data generated by the code. If anomalies are detected, Data Quality determines whether to fail the node and block the descendant nodes based on the check result and rule settings. This prevents dirty data from spreading downstream.
View the check result
- View the check result in Operation Center
- View the value of the Instance Status parameter. A possible reason why the instance generated for a node fails a quality check is that the node code is successfully executed, but the data generated by the node does not meet expectations. If the instance fails the quality check of a strong monitoring rule, the current instance fails and the descendant instances are blocked. In this case, the current instance is in the Quality monitor fail state.
- Click DQC Log in the lower part of the Runtime Log tab to view the data quality check result. For more information, see View auto triggered node instances.
- View the check result on the Node Query page in Data Quality
On the Node Query page, you can filter nodes by the table name, topic name, node ID, or node name. Then, you can view the historical check records and details of a specific node. For more information, see View monitoring results.