All Products
Search
Document Center

:View monitoring data

Last Updated:Jun 20, 2026

The ApsaraDB for MongoDB management console provides a wide range of performance metrics to help you monitor the status of your instances.

Background

Note the following information about the monitoring feature in ApsaraDB for MongoDB:
  • The monitoring feature differs between the new and old versions of the ApsaraDB for MongoDB management console. We recommend that you use the new console to access more features.
  • If you are using the new management console, a collection frequency of once per second or once per 300 seconds is expected for an instance in the following cases:
    • Some existing instances inherit their original collection frequency settings.
    • The instance uses a collection frequency that was configured in the old ApsaraDB for MongoDB management console.
  • If you are using the old management console and the collection frequency for an instance is once per 60 seconds, this is expected. It indicates that the instance was created after the collection frequency was standardized to once per 60 seconds. For more information, see the announcement about the change of the collection frequency to 60 seconds.

Notes

  • If you receive an alert message from Alibaba Cloud, for example, an alert indicating that CPU utilization exceeds 80%, analyze the monitoring data in the console to troubleshoot the issue. Filter by node to check for and identify any anomalies.
  • Monitoring data is retained for up to 7 days.

Procedure

  1. Log on to the ApsaraDB for MongoDB console.

  2. In the upper-left corner of the page, select the resource group and region to which the instance belongs.

  3. In the left-side navigation pane, click Replica Set Instances or Sharded Cluster Instance based on the instance type.

  4. On the page that appears, find the instance that you want to manage and click its ID.

  5. In the left-side navigation pane, click Monitoring Data.
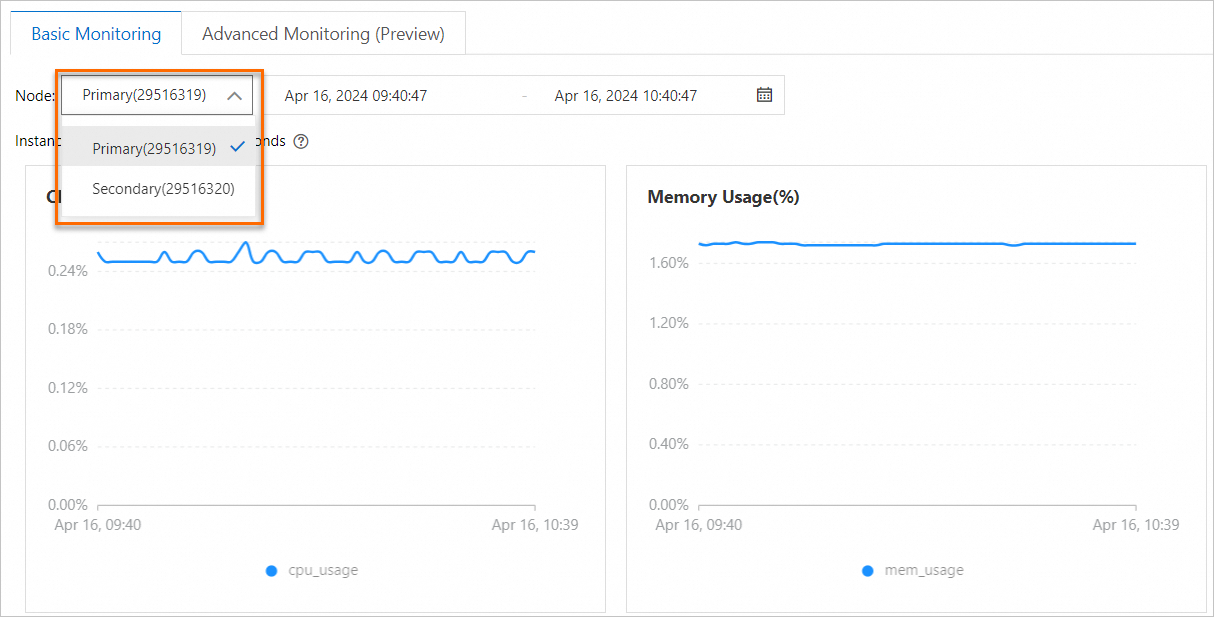
  6. Based on the instance type, select the node to view its monitoring data.
    Note By default, the console displays monitoring data from the last 24 hours. You can also select a time range to view historical data.
    • Single-node instance: Monitoring data for the primary node is displayed. You cannot change the selection.
    • Replica set instance: At the top of the page, select a primary node or secondary node.
    • Sharded cluster instance: At the top of the page, select a mongos node, shard node, or ConfigServer node.
      Note Node IDs prefixed with s- are mongos nodes, those prefixed with d- are shard nodes, and those suffixed with -cs are ConfigServer nodes.
      分片集群实例监控信息

Metrics

Metric Description
CPU utilization cpu_usage: The CPU utilization of the instance.
memory usage mem_usage: The memory usage of the instance.
IOPS The number of I/O operations per second (IOPS). This metric includes:
  • data_iops: The IOPS of the data disk.
  • log_iops: The IOPS of the log disk.
IOPS usage iops_usage: The ratio of the IOPS used by the instance to the maximum available IOPS.
Disk space usage The disk space used by the instance. This metric includes:
  • ins_size: The total used space.
  • data_size: The space used by the data disk.
  • log_size: The space used by the log disk.
disk usage disk_usage: The ratio of the total disk space used by the instance to the maximum available disk space.
Operation QPS The number of operations per second (QPS) on the instance. This metric includes the number of:
  • insert operations.
  • query operations.
  • delete operations.
  • update operations.
  • getmore operations.
  • command operations.
connections current_conn: The current number of connections to the instance.
Cursors The number of cursors currently used by the instance. This metric includes:
  • total_open: The number of open cursors.
  • timed_out: The number of cursors that timed out.
network traffic The network traffic of the instance. This metric includes:
  • bytes_in: The inbound traffic.
  • bytes_out: The outbound traffic.
  • num_requests: The number of processed requests.
Global lock queue length The length of queues waiting for global locks on the instance. This metric includes:
  • gl_cq_readers: The length of the queue waiting for global read locks.
  • gl_cq_writers: The length of the queue waiting for global write locks.
  • gl_cq_total: The total length of queues waiting for global locks.
WiredTiger The cache-level metrics of the WiredTiger engine. This metric includes:
  • bytes_read_into_cache: The amount of data read into the cache.
  • bytes_written_from_cache: The amount of data written from the cache to the disk.
  • maximum_bytes_configured: The maximum configured cache size.
replication latency repl_lag: The data synchronization latency between the primary and secondary nodes.
WT request queues The number of concurrent read and write requests being processed (out) and the number of available concurrent request slots (available). This metric includes:
  • write_concurrent_trans_out: The number of concurrent write requests being processed.
  • read_concurrent_trans_out: The number of concurrent read requests being processed.
  • write_concurrent_trans_available: The number of available concurrent write requests.
  • read_concurrent_trans_available: The number of available concurrent read requests.
I/O latency iocheck_cost: Measures the response time of I/O operations.
Note This metric is applicable only to replica set instances.