通过运营报表功能,您可以查询加速域名在各个不同时间段的离线分析数据;通过分析数据,便于您了解加速域名的运行状况,帮助您进行业务状态分析。
前提条件
您已成功添加加速域名。如果未添加,请参见添加加速域名进行添加。
功能介绍
运营报表统计并默认展示了用户访问的PV/UV、地区和运营商、域名排行、热门referer、热门URL、回源热门URL和Top客户端IP等内容,您可以根据业务需求,定制和订阅报表,订阅成功后系统会将报表发送到您的指定邮箱,您可以对报表内容进行分析,了解加速域名的运行状况。
报表内容 | 描述 |
PV/UV | 支持按时间查询域名的PV和UV。 |
地区和运营商 | 查看中国内地、中国香港、中国澳门和中国台湾及海外地区指定时间区间的用户访问区域分布和用户运营商分布情况。 |
域名排行 | 展示各个加速域名的访问排名,包含占比、流量或带宽峰值、峰值时刻和访问次数。 说明 查询域名排行以天为最小粒度。例如当您选择需要查询的日期后,系统为您显示对应日期的TOP200信息。 |
热门referer | 展示热门Referer防盗链的流量、流量占比、访问次数和访问占比。 说明 运营报表功能在分析用户日志的时候,会统计用户请求日志中的http_referer字段信息,统计结果包含以下两种情况:
|
热门URL | 查询您指定域名、指定状态码、指定日期的热门URL,包括流量、流量占比、访问次数和访问占比。 说明 查询热门URL以天为最小粒度。例如当您选择需要查询的日期后,系统为您显示对应日期的TOP3000信息。 |
回源热门URL | 查询您指定域名、指定状态码、指定日期的回源热门URL,包括流量、流量占比、访问次数和访问占比。 说明 查询回源热门URL以天为最小粒度。例如当您选择需要查询的日期后,系统为您显示对应日期的TOP100信息。 |
Top客户端IP | 查询您指定域名、指定区域、指定日期的Top客户端IP,支持按流量或请求数进行排行。 说明 Top客户端IP以天为最小粒度。当您选择需要查询的日期后,如果您查询的是全部区域,系统为您显示对应日期的TOP200信息;如果您查询的是单个区域,系统为您显示对应日期的TOP20信息。 |
订阅运营报表之后,阿里云CDN将会定期给您的邮箱发送报表邮件,邮件的报表中展示的“流量”数据,其单位为byte。
定制运营报表
使用运营报表功能前,您需要先定制运营报表才能进行数据生产统计。由于受日志完整性延迟的影响,数据生产时延较长,定制的报表通常需要在T+1天的6点左右才能查看到。例如,2025年7月16日定制的报表,在2025年7月17日6点左右可以查看到。
T日创建运营报表,能获取T+1日及之后的运营报表数据,T日及之前的运营报表数据无法获取;运营报表数据获取延迟6小时以上,不同指标项的生产间隔不同(1-6小时不等),故至少T+1日 6点后才能看到T+1日的运营报表数据;
不同指标项的报表数据生产间隔时间:
热门URL(支持按请求数或者流量排序):6小时
热门Referer(支持按请求数或者流量排序):1小时
回源热门URL(支持按请求数或者流量排序):1小时
Top客户端IP(支持按请求数或者流量排序):6小时
域名排行(仅支持按流量排序):1
PV/UV:1小时
访问区域分布:1小时
运营商分布:1小时
其它报表相关的数据默认不在控制台展示,您可以通过报表订阅的方式,发送至指定邮箱,再查询相关数据。
登录CDN控制台。
在左侧导航栏,选择。
在运营报表页签下,打开定制运营报表按钮。
您可观测到您账号下PV/UV、地区和运营商、域名排行、热门referer、热门URL、回源热门URL和Top客户端IP的具体信息。
订阅运营报表
订阅运营报表前需确保已经成功定制了运营报表,否则将无法订阅成功。成功订阅运营报表后,系统会将报表发送到您的指定邮箱,您可以对报表内容进行分析。
目前订阅功能处于试运行阶段,一个阿里云账号(包含RAM用户)最多可以创建五个订阅任务。
由于受日志完整性延迟的影响,数据生产时延较长,系统需完全获取到所有数据后才会发送报表。
登录CDN控制台。
在左侧导航栏,选择。
在运营报表页面,单击订阅任务页签。
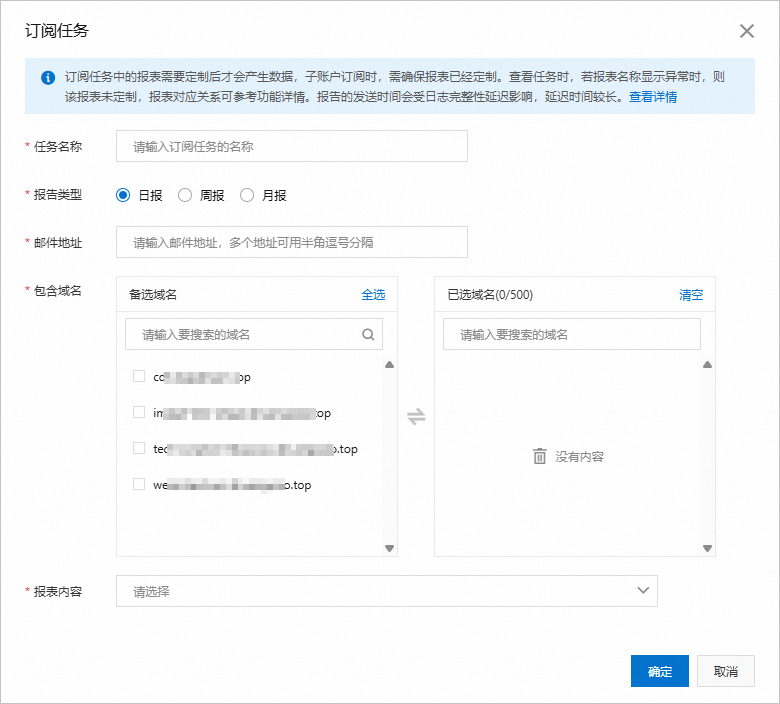
单击订阅任务,配置订阅信息。
参数
描述
任务名称
输入订阅任务名称。
报告类型
支持日报、周报和月报三种报告类型,同时只能选择其中一种报告类型。
日报:前一天的日志数据统计完整并计算完成后由系统发送至您的邮箱。
周报:按照自然周计算,当一周的日志数据统计完整并计算完成后由系统发送至您的邮箱。通常前一周的报表,会在下一周的周一上午发送。
月报:按照自然月计算,当一个月的日志数据统计完整并计算完成后由系统发送至您的邮箱。
邮件地址
接收运营报表的邮箱地址。支持同时输入多个邮箱地址,多个邮箱地址用英文逗号(,)分隔。
包含域名
选择您要订阅运营报表的加速域名。
报表内容
选择您要订阅的报表内容。
单击确定,系统提示订阅任务创建成功。
说明报表订阅成功后,如果您在定制运营报表中删除了某个报表内容,此时您在订阅任务中单击编辑查看任务时,被删除的报表内容会显示异常(显示的是报表ID),表示该报表未定制,您将无法订阅该报表内容。报表ID与报表名称的对应关系,请参见报表对应关系。
报表中展示“流量”数据,其单位均为byte。
可选:修改订阅任务。
选择需要修改的订阅任务,单击编辑,根据步骤4配置方法,完成修改后,单击确定。
报表对应关系
报表ID与报表名称的对应关系见下表。
报表ID | 英文名称 | 中文名称 | 计算方法 |
1 | TopUrlByAcc | 热门URL(按请求数排序) | 按照URL的条数统计。 |
3 | TopUrlByTraf | 热门URL(按流量排序) | 按照流量排行次序统计排序,流量数值会增加上TCP包头系数。详细信息,请参见为什么监控查询流量、用量查询流量与日志统计流量有差异?。 |
5 | TopReferByAcc | 热门Referer(按请求数排序) | 按照访问次数统计。 |
7 | TopReferByTraf | 热门Referer(按流量排序) | 按照流量排行次序统计排序,流量数值会增加上TCP包头系数。详细信息,请参见为什么监控查询流量、用量查询流量与日志统计流量有差异?。 |
9 | OriginTopUrlByAcc | 回源热门URL(按请求数排序) | 按照URL的条数统计。 |
11 | OriginTopUrlByTraf | 回源热门URL(按流量排序) | 按照流量排行次序统计排序,流量数值会增加上TCP包头系数。详细信息,请参见为什么监控查询流量、用量查询流量与日志统计流量有差异?。 |
13 | TopIpByAcc | Top客户端IP(按请求数排序) | 按照访问IP的访问次数进行排序。 |
15 | TopIpByTraf | Top客户端IP(按流量排序) | 按照流量排行次序统计排序,流量数值会增加上TCP包头系数。详细信息,请参见为什么监控查询流量、用量查询流量与日志统计流量有差异?。 |
17 | DomainByTraf | 域名排行(按流量排序) | 按照域名的流量排序。 |
19 | DomainPvUv | PV/UV | |
21 | AreaTrafStat | 访问区域分布 | 统计某个域名在某个地域的分布。 |
23 | IspTrafStat | 运营商分布 | 统计某个域名在某个运营商的分布。 |
关闭定制的运营报表
关闭定制运营报表,所有的订阅任务都会停止产生数据但订阅任务还在,如果您的业务不再需要该订阅任务,可在订阅任务页签手动删除即可,删除方法请参见删除订阅任务。
登录CDN控制台。
在左侧导航栏,选择运营报表。
在运营报表页面,单击关闭定制运营报表。
单击确定关闭定制运营报表。
删除订阅任务
登录CDN控制台。
在左侧导航栏,选择运营报表。
在订阅任务页面,选择需要删除的订阅任务,单击删除。
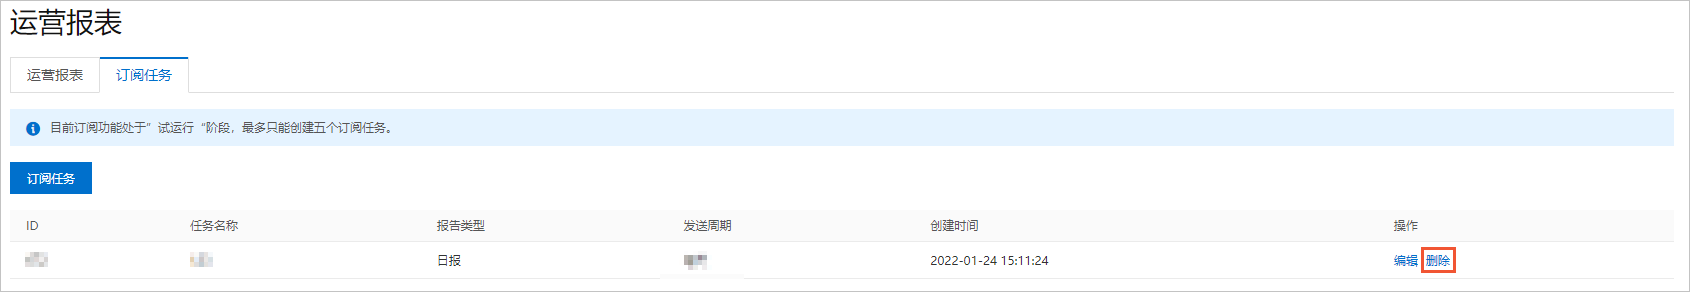
单击确定删除订阅任务。
常见问题
为什么运营报表定制成功了没有数据?
支持订阅几个报表任务?
相关文档
运营报表相关API接口,请参见运营报表。