Global Accelerator (GA) は、Simple log Serviceが提供するアクセスログ機能をサポートしています。 この機能により、ユーザーの行動を記録し、ユーザーの地理的分布に関する情報を取得し、問題のトラブルシューティングを行うことができます。
アクセスログの概要
GAインスタンスの1つ以上のエンドポイントグループのアクセスログを作成できます。 収集されたログデータは、エンドポイントグループがデプロイされているリージョンのSimple log Serviceが提供するログストアに配信されます。 アクセスログエントリには、送信元IPアドレス、送信元ポート、宛先IPアドレス、宛先ポート、およびアクセラレーション領域の情報が含まれます。 フィールドの詳細については、「フィールドの説明」をご参照ください。

利用シナリオ
課題の特定
アクセスログの情報に基づいて問題をトラブルシューティングできます。
たとえば、アクセスログのstatusフィールドに基づいて、GAが期待される応答を返すかどうかを確認し、問題の原因を特定できます。
ビジネスの計画
アクセスログを分析して、情報に基づいたビジネス上の意思決定を行うことができます。
たとえば、帯域幅プランを事前にアップグレードして、アクセラレーションエリアのトラフィックの傾向に基づいてビジネス要件を満たし、帯域幅プランをダウングレードしてコストを削減し、指定された期間内にアプリケーションにアクセスするホストを表示して、アクセスログのhttp_hostフィールドに基づいてアプリケーションのアップグレードを計画できます。
説明
アクセスログ機能の使用に追加料金は発生しません。 Simple Log Serviceの料金のみを支払う必要があります。 詳細については、「Simple Log Serviceの課金」をご参照ください。
制限事項
アクセスログ機能は、Simple log Serviceが利用可能なリージョンでのみサポートされています。 詳細については、「サポートされているリージョン」をご参照ください。
標準GAインスタンスのみがアクセスログ機能をサポートしています。 基本的なGAインスタンスは、アクセスログ機能をサポートしていません。 このトピックでは、標準のGAインスタンスを例として使用します。
エンドポイントグループがAlibaba Cloudのポイントオブプレゼンス (PoP) ノードにデプロイされている場合、エンドポイントグループのアクセスログを収集することはできません。
エンドポイントのドメイン名を照会することはできません。
アクセスログ機能を使用できない場合、インスタンスは以前のバージョンを使用している可能性があります。 GAインスタンスをアップグレードするには、アカウントマネージャーにお問い合わせください。
アクセスログの作成
GAインスタンスのアクセスログを作成する前に、リスナーとエンドポイントグループがGAインスタンスに追加されていることを確認してください。 詳細については、「インテリジェントルーティングリスナーの追加と管理」をご参照ください。
GAコンソールにログインします。
インスタンスページで、管理するGAインスタンスのIDをクリックします。
インスタンスの詳細ページで、アクセスログタブをクリックします。
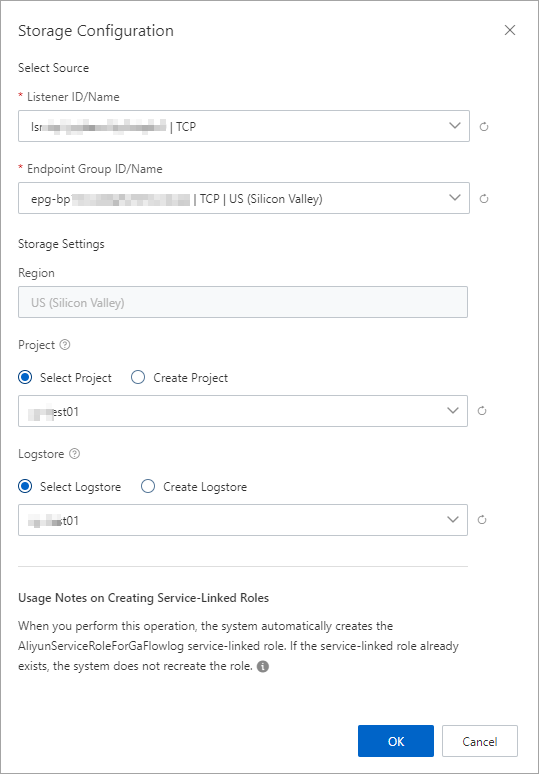
[アクセスログ] タブで、[アクセスログの作成] をクリックします。 [ストレージ設定] ダイアログボックスで、次のパラメーターを設定し、[OK] をクリックします。
パラメーター
説明
ソースの選択
リスナーID /名前
リスナーを選択します。
エンドポイントグループID /名前
宛先エンドポイントグループを選択します。
ストレージ設定
リージョン
デフォルトでは、エンドポイントグループが存在するリージョンが選択されています。
プロジェクト
Simple Log Serviceのプロジェクトは、リソースの分離と管理に使用されます。
[プロジェクトの選択] をクリックして、既存のプロジェクトを選択できます。 [プロジェクトの作成] をクリックしてプロジェクトを作成することもできます。
ログストア
Simple log Serviceでログデータの収集、保存、クエリに使用するLogstoreを選択します。
[Logstoreの選択] をクリックすると、既存のLogstoreを選択できます。 [Logstoreの作成] をクリックしてLogstoreを作成することもできます。
説明この操作を実行すると、サービスにリンクされたロールAliyunServiceRoleForGaFlowlogがGAに割り当てられているかどうかが確認されます。
サービスにリンクされたロールAliyunServiceRoleForGaFlowlogが存在しない場合、システムは自動的にサービスにリンクされたロールを作成し、ポリシーAliyunServiceRolePolicyForGaFlowlogをサービスにリンクされたロールにアタッチします。 これにより、GAはSimple Log Serviceにアクセスし、フローログをSimple Log Serviceに配信できます。
サービスにリンクされたロールAliyunServiceRoleForGaFlowlogがGAに割り当てられている場合、システムはロールを再作成しません。
詳細については、「AliyunServiceRoleForGaFlowlog」をご参照ください。
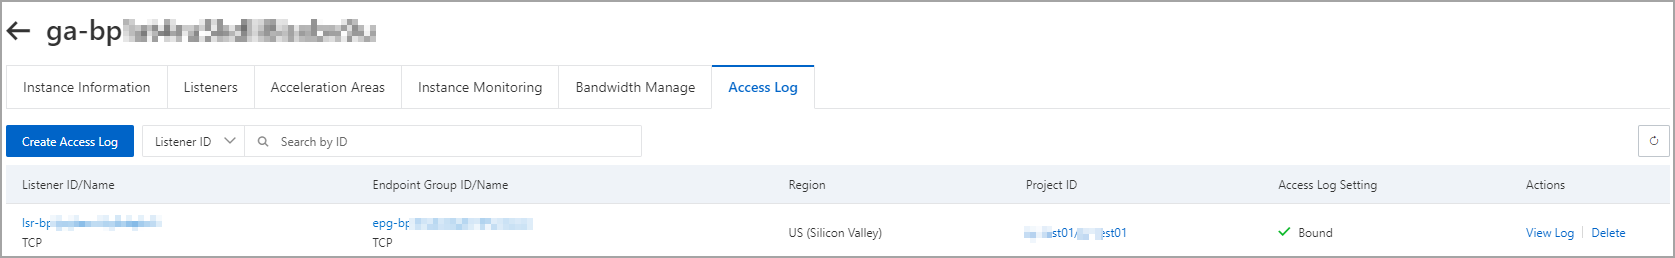
アクセスログの作成後、[アクセスログ] タブでアクセスログを表示できます。
その他操作
API 操作 | 説明 |
アクセスログの表示 |
|
アクセスログの削除 |
|
Simple Log Serviceがアクセスログを収集した後、アクセスログをダウンロード、配信、および処理できます。 アクセスログのアラートルールを作成することもできます。 詳細については、「Alibaba Cloudサービスのログに対する一般的な操作」をご参照ください。
例
生のアクセスログを表示する
LogstoreページのRaw Logsタブで、rawアクセスログに関する情報を表示できます。
たとえば、client_ipフィールドをクリックして、クライアントのIPアドレスを表示できます。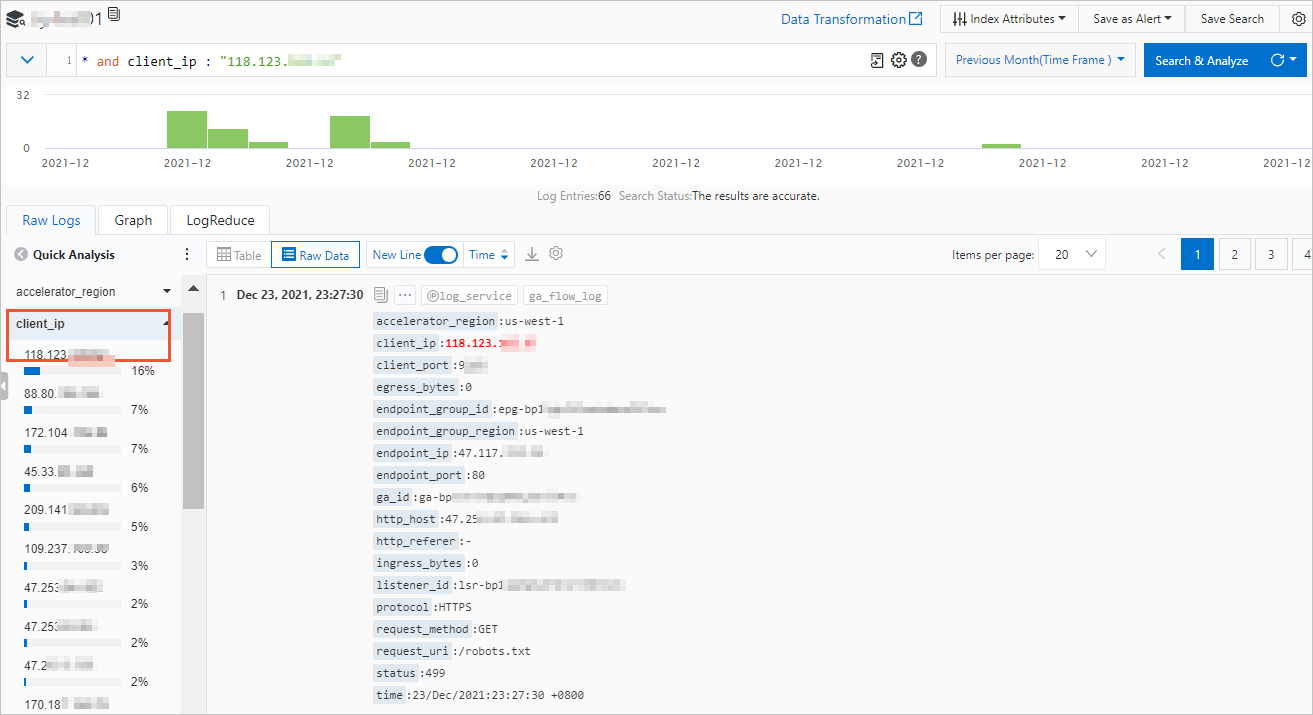
指定されたアクセスログの照会
Logstoreページで、[検索と分析] 検索ボックスにSQL文を入力して、指定したアクセスログを検索します。
たとえば、次の図の手順を実行して、クライアントIPアドレスの配布を照会できます。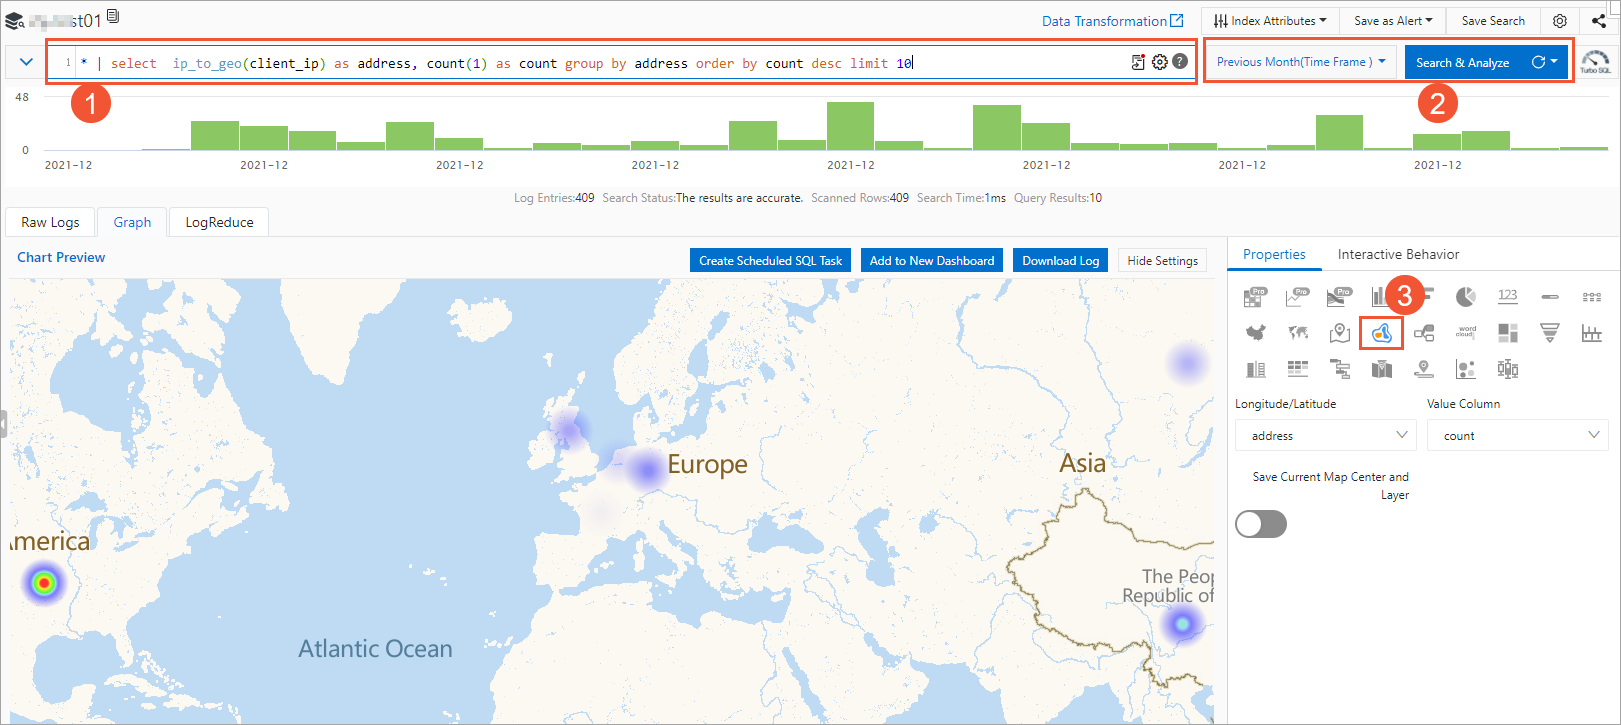
いいえ | 説明 |
① | 次のSQL文を入力して、クライアントIPアドレスのヒートマップを照会し、クライアントが分散している上位10のリージョンを表示します。 これはあなたのビジネスを計画するのに役立ちます。 |
② | アクセスログが生成される時間範囲を選択し、[検索と分析] をクリックします。 |
③ | [グラフ] > [プロパティ] タブで、 |
ログフィールド
次の表に、Simple Log Serviceコンソールで照会できるアクセスログのフィールドを示します。
項目 | 説明 |
accelerator_region | アクセラレーションリージョン。 |
client_ip | 送信元IPアドレスであるクライアントのIPアドレス。 |
client_port | ソースポートであるクライアントのポート。 |
egress_bytes | トラフィック情報が収集された期間中のアウトバウンドトラフィック。 |
endpoint_group_id | エンドポイントグループの ID。 |
endpoint_group_region | エンドポイントグループがデプロイされているリージョン。 |
endpoint_ip | エンドポイントのIPアドレス。宛先IPアドレスです。 |
endpoint_port | 宛先ポートであるエンドポイントのポート。 |
ga_id | GA インスタンスの ID です。 |
ingress_bytes | ログが作成された期間中のインバウンドトラフィック。 |
listener_id | リスナーの ID を示します。 |
protocol | リスナーが使用するネットワーク伝送プロトコル。 |
status | GAによって送信される応答パケットのステータス。 |
time | ログエントリが作成された時間。 |
upstream_connect_time | 接続期間。 |
upstream_first_byte_time | 最初のパケットまでの時間。 |
次のフィールドは、HTTPおよびHTTPSリスナーを使用する場合に使用できます。
項目 | 説明 |
http_host | リクエストのHostヘッダー。 |
http_referer | GAが受信したリクエストのHTTP Refererヘッダー。 |
request_method | リクエスト方式。 |
request_uri | GAが受信したリクエストのURI。 |