Querying and analyzing log data in real time helps you understand your network activity and identify traffic anomalies. This capability enhances security monitoring and improves incident response. This topic describes how to use query and analytic statements for log analysis and how to view and understand the results.
Statement syntax
Query statements and analytic statements
Statements for log analysis consist of a query statement and an analytic statement, separated by a vertical bar (|).
query statement|analytic statementA query statement uses Simple Log Service syntax to find logs that meet specified conditions. It can be used independently. A query statement can contain keywords, numeric values, value ranges, spaces, or asterisks (*). A space or an asterisk (*) indicates that no filter condition is applied.
Based on how indexes are configured, queries are classified as full-text search or field search. For more information, see Query syntax and functions.
An analytic statement calculates and generates statistics from query results or the full dataset. It must be used with a query statement. If the analytic statement is empty, only the query results are returned and no analysis is performed. For more information about the syntax and functions of analytic statements, see Overview of query and analysis.
Common query statements
This section provides common query syntax and examples for Cloud Firewall logs.
Traffic volume queries
Query network access records from the internet to the internal asset
1.2.*.*, and calculate the total inbound traffic volume and the total number of packets.log_type:internet_log and direction:"in" and dst_ip:1.2.*.* | select sum(in_packet_bytes) as flow, sum(in_packet_count) as packetQuery NAT firewall traffic, group the results by source IP, destination IP, and destination port, and then analyze the top 10 assets by total inbound and outbound traffic volume.
log_type:nat_firewall_log | select src_ip, dst_ip, dst_port, sum(in_packet_bytes) as in_bytes, sum(out_packet_bytes) as out_bytes, sum(total_packet_bytes) as total_bytes group by src_ip, dst_ip, dst_port order by total_bytes desc limit 10
Access control
Query for traffic logs for access from the internet to internal assets that match an access control policy.
log_type:internet_log and direction:"in" and not acl_rule_id:00000000-0000-0000-0000-000000000000The condition
not acl_rule_id:00000000-0000-0000-0000-000000000000filters for logs where an access control policy was matched. Anacl_rule_idof all zeros indicates that no policy was matched.Query for traffic logs of outbound access from internal assets to the internet that was blocked by an access control policy, and analyze the distribution of the top 10 destination IP addresses and destination ports.
log_type:internet_log and direction:out and not acl_rule_id:00000000-0000-0000-0000-000000000000 and rule_result:drop | select dst_ip, dst_port, count(*) as cnt group by dst_ip, dst_port order by cnt desc limit 10Query for traffic logs of outbound access from internal assets to the internet where the destination port is 443, the packet count is greater than 3 (indicating a complete TCP three-way handshake), and the domain name is not identified. The results are grouped by the destination IP address segment and application to analyze the top 10 source IPs, destination IPs, and applications.
log_type:internet_log and direction:out and dst_port:443 and total_packet_count>3 and domain:""| select array_agg(distinct src_ip) as srcip, array_agg(distinct dst_ip) as dstip, slice(split(dst_ip,'.' ,4),1,3) as dstip_c, app_name, COUNT(1) as cnt GROUP by dstip_c,app_name order by cnt desc limit 10
Attack prevention
Query for traffic logs for access from the internet to internal assets that match an attack prevention policy.
log_type:internet_log and direction:"in" and not ips_rule_id:00000000-0000-0000-0000-000000000000The condition
not ips_rule_id:00000000-0000-0000-0000-000000000000filters for logs where an attack prevention policy was matched. Anips_rule_idof all zeros indicates that no policy was matched.Query for traffic logs of outbound access from internal assets to the internet that match an attack prevention policy, and view information such as IP addresses, ports, application, domain, and IPS policy results.
log_type:internet_log and direction:out and not ips_rule_id:00000000-0000-0000-0000-000000000000 | select src_ip, dst_ip, dst_port,app_name, domain,ips_rule_id, ips_rule_name, rule_result
Procedure
Log on to the Cloud Firewall console.
In the navigation pane on the left, choose , and then click the Logs tab.
(Optional) By default, the system automatically runs a query and displays the results when you open the Logs page. Click the
 icon in the upper-right corner of the page. On the Query Settings tab, disable this feature or set the query time.
In the search box, enter a query statement and an analytic statement.
A query statement is used to view, search, and filter log data. You can use a query statement with specific conditions, such as time range, request type, and keywords, to filter for the data that you want. A query statement can be used by itself. For more information about the syntax, see Query syntax and features.
An analytic statement is used to perform operations on log data, such as filtering, transforming, statistical analysis, and aggregation. For example, you can calculate the average value of data over a period of time or get year-over-year and month-over-month results. An analytic statement must be used together with a query statement in the format
query statement|analytic statement. For more information about the syntax, see Aggregate functions.
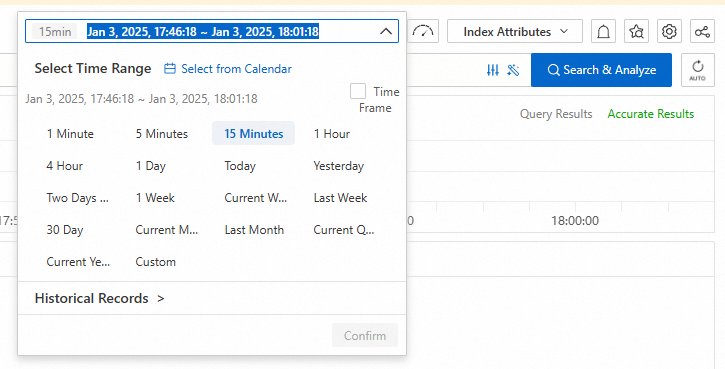
Set the time range for log query/analysis in one of the following three ways. If a time range is set in the analytic statement, the query and analysis results are based on that time range.
NoteBy default, a query returns a maximum of 100 rows. To return more data, use the LIMIT clause.
-
In the time range picker at the top of the page, select a time range, such as 15 Minutes.
-
In an analytic statement, use the
__time__field to specify a time range. Example:* | SELECT * FROM log WHERE __time__ > 1731297600 AND __time__ < 1731310038 -
In an analytic statement, use the from_unixtime function or to_unixtime function to convert time formats. Examples:
* | SELECT * FROM log WHERE from_unixtime(__time__) > from_unixtime(1731297600) AND from_unixtime(__time__) < now()* | SELECT * FROM log WHERE __time__ > to_unixtime(date_parse('2024-10-19 15:46:05', '%Y-%m-%d %H:%i:%s')) AND __time__ < to_unixtime(now())
-
Click Query/Analysis to view the query and analysis results. For more information, see View query and analysis results.
View query and analysis results
The histogram and raw logs modules display the results of your query and analysis.
If you do not set the limit parameter in an analytic statement, 100 entries are returned by default. To return more entries, manually set the limit parameter.
This section describes the data displayed in the histogram and raw logs. For information about other features, see Quick start for Log Query and Analysis.
Histogram
The histogram shows the time distribution of the queried logs.
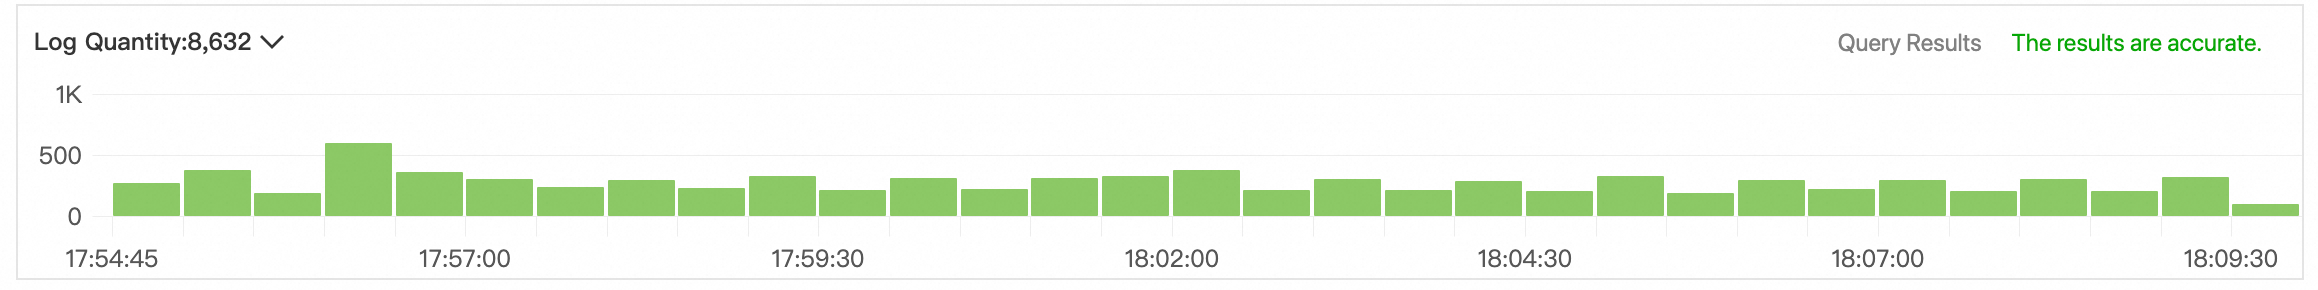
Hover the pointer over a green data block to view its time range and the number of log hits.
Double-click a green data block to view the log distribution in a finer time granularity. The query results for the specified time range are also displayed on the Raw Logs tab.
Raw logs
The Raw Logs tab displays the results of your log query and analysis.
No. | Description |
① | Change the log display format, sort order, and other settings. |
② | Click the |
③ |
|
④ | Displays the display fields, indexed fields, and system fields for logs.
|
⑤ |
|
⑥ | Displays log details. For a detailed description of log fields, see Log fields.
|
Related documents
For detailed descriptions of log fields, fields that support indexing, and more, see Log fields.
You can export log query and analysis results to your local computer or deliver them to Object Storage Service (OSS) for storage. For more information, see Export logs.
Use log reports to view statistical data, such as basic protection metrics for Cloud Firewall, traffic source and destination distribution, and system stability. For more information, see View log reports.
Why are there periodic ICMP probe traffic logs from Alibaba Cloud?