After you create an ApsaraMQ for RabbitMQ instance, CloudMonitor automatically starts monitoring it. You can view monitoring data for instances, vhosts, queues, and exchanges to analyze instance usage. You can also set alert rules for metrics to receive alert messages when data is abnormal and handle threats promptly.
Prerequisites
If you log on as a RAM user, you must grant the `AliyunCloudMonitorReadOnlyAccess` permission to the RAM user in the Resource Access Management (RAM) console. For more information, see Step 2: Grant permissions to a RAM user.
The following code describes the policy that is used to query metrics in CloudMonitor:
{
    "Version": "1",
    "Statement": [
        {
            "Action": "cms:QueryMetric*",
            "Resource": "*",
            "Effect": "Allow"
        }
    ]
}
Billing
You are not charged for using the CloudMonitor feature with ApsaraMQ for RabbitMQ.
Metrics
The new version of ApsaraMQ for RabbitMQ supports the following metrics:
|
Group |
Metric |
Unit |
Namespace |
MetricName |
Dimensions |
Statistics |
|
Average inbound message rate of an instance (per minute) Note
Instance inbound message rate = Total inbound messages in 1 minute / 60 |
items per second |
acs_amqp |
InstanceTPSIn |
userId, regionId, instanceId |
Value |
|
|
Average outbound message rate of an instance (per minute) Note
Instance outbound message rate = Total outbound messages in 1 minute / 60 |
items/s |
acs_amqp |
InstanceTPSOut |
userId, regionId, instanceId |
Value |
|
|
Peak API request rate of an instance (max value per minute) Note
How the value is obtained: The maximum value of 60 samples taken once per second over a 1-minute period. |
requests/s |
acs_amqp |
InstanceMaxTpsInMiunte |
userId, regionId, instanceId |
Value |
|
|
Number of consumers |
Unit |
acs_amqp |
InstanceConsumers |
userId, regionId, instanceId |
Value |
|
|
Number of connections |
Count |
acs_amqp |
InstanceConnections |
userId, regionId, instanceId |
Value |
|
|
Number of channels |
item |
acs_amqp |
InstanceChannelsNew |
userId, regionId, instanceId |
Value |
|
|
Vhost |
Inbound messages per second |
items per second |
acs_amqp |
VHostTPSIn |
userId, regionId, instanceId, vhostName |
Value |
|
Outbound messages per second |
items per second |
acs_amqp |
VHostTPSOut |
userId, regionId, instanceId, vhostName |
Value |
|
|
Number of consumers |
Unit |
acs_amqp |
InstanceVhostConsumers |
userId, regionId, instanceId, vhostName |
Value |
|
|
Number of connections |
Count |
acs_amqp |
VhostConnections |
userId, regionId, instanceId, vhostName |
Value |
|
|
Number of channels |
Item |
acs_amqp |
VhostChannels |
userId, regionId, instanceId, vhostName |
Value |
|
|
Queue |
Inbound messages per second |
messages/s |
acs_amqp |
QueueTPSIn |
userId, regionId, instanceId, vhostName, queueName |
Value |
|
Outbound messages per second |
items per second |
acs_amqp |
QueueTPSOut |
userId, regionId, instanceId, vhostName, queueName |
Value |
|
|
Number of consumers |
Unit |
acs_amqp |
InstanceVhostQueueConsumers |
userId, regionId, instanceId, vhostName, queueName |
Value |
|
|
Message accumulation Note
The number of accumulated messages in a queue is calculated as follows:
|
Unit |
acs_amqp |
InstanceVhostQueueMessageAccum |
userId, regionId, instanceId, vhostName, queueName |
Maximum |
|
|
Exchange |
Inbound messages per second |
items per second |
acs_amqp |
ExchangeTPSIn |
userId, regionId, instanceId, vhostName, exchangeName |
Value |
|
Outbound messages per second |
messages/s |
acs_amqp |
ExchangeTPSOut |
userId, regionId, instanceId, vhostName, exchangeName |
Value |
You can call the DescribeMetricMetaList operation to obtain information about the preceding ApsaraMQ for RabbitMQ metrics.
View monitoring data
Log on to the ApsaraMQ for RabbitMQ console. In the left-side navigation pane, click Instances.
In the top navigation bar of the Instances page, select the region where the instance that you want to manage resides. Then, in the instance list, click the name of the instance that you want to manage.
-
In the navigation pane on the left, click Monitoring and Alerting.
-
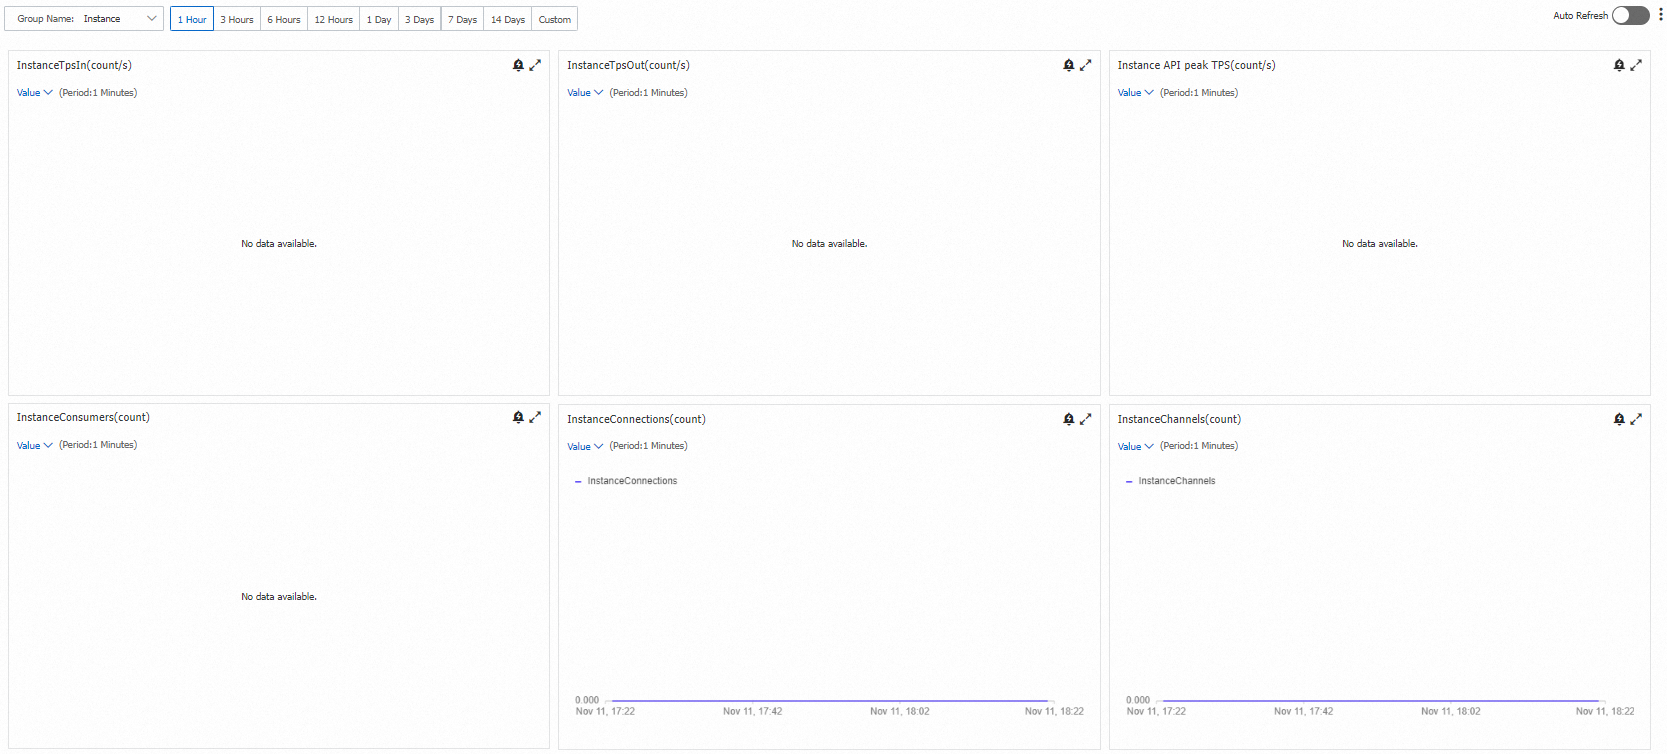
On the Monitoring and Alerting page, select a resource in the Group section and set a time range.
The following figure shows an example of monitoring data for a resource on the Monitoring and Alerting page.
Create an alert rule
Log on to the ApsaraMQ for RabbitMQ console. In the left-side navigation pane, click Instances.
In the top navigation bar of the Instances page, select the region where the instance that you want to manage resides. Then, in the instance list, click the name of the instance that you want to manage.
-
In the navigation pane on the left, click Monitoring and Alerting.
-
In the upper-right corner of the Monitoring and Alerting page, move the pointer over the
 icon and click Set Alert Rule.
You are redirected to the Alert Rules page of CloudMonitor.
-
On the Alert Rules page, click Create Alert Rule. In the Create Alert Rule panel, configure the parameters for the alert rule. For more information, see Alert service.
References
For more information about how to query monitoring data using an API, see DescribeMetricMetaList.