Application Real-Time Monitoring Service (ARMS) supports OpenTelemetry-based trace ingestion from Java applications. You can export traces directly from your application using the OpenTelemetry SDK, or forward them through an OpenTelemetry Collector.
Prerequisites
Before you begin, make sure that you have:
An activated ARMS instance
A Java application ready for instrumentation
Your ARMS trace ingestion endpoint and authentication token (the token is available from the ACK console)
Choose an integration method
| Method | Best for | What it does |
|---|---|---|
| ARMS agent + OpenTelemetry SDK | Auto-instrumenting common components with custom spans for specific methods | The ARMS agent handles common components automatically. You add custom spans with the OTel SDK only where needed. |
| OpenTelemetry SDK + Jaeger exporter | Full manual control over instrumentation | You instrument each component explicitly and export traces through a Jaeger exporter. Fully standard OTel -- no vendor-specific agent required. |
| OpenTelemetry Collector | Centralizing trace collection from multiple services | You deploy a Collector as a central pipeline and configure an OTLP exporter to forward traces to ARMS. |
Export traces directly from your application
Use the ARMS agent with OpenTelemetry SDK for Java
The ARMS agent for Java (V2.7.1.3 and later) supports OpenTelemetry SDK extensions. The agent auto-instruments common components. Use the OpenTelemetry SDK to add custom spans for methods the agent does not cover.
For setup steps, see Use OpenTelemetry SDK for Java to manually instrument an application.
Use the OpenTelemetry SDK with a Jaeger exporter
Instrument your application with the OpenTelemetry SDK for Java and export trace data through a Jaeger exporter. This approach gives you full control over which components are instrumented and uses standard OpenTelemetry APIs with no vendor-specific agent.
For setup steps, see Use OpenTelemetry to submit the trace data of Java applications.
Forward traces through OpenTelemetry Collector
To route traces through the OpenTelemetry Collector, configure the OTLP exporter in your Collector configuration file with your ARMS endpoint and authentication token.
Collector exporter configuration
Add the following to your Collector configuration file (otel-collector-config.yaml):
exporters:
  otlp:
    endpoint: <endpoint>:8090
    tls:
      insecure: true
    headers:
      Authentication: <token>
Configuration parameters
Replace the placeholders with your values:
| Parameter | Description | Example |
|---|---|---|
<endpoint> | ARMS trace ingestion endpoint for your region | http://tracing-analysis-dc-bj.aliyuncs.com:8090 |
<token> | Authentication token obtained in the ACK console | b590lhguqs@3a7*********9b_b590lhguqs@53d*****8301 |
Verify and use trace data in ARMS
After your application starts sending traces, the following features help you monitor and debug your applications.
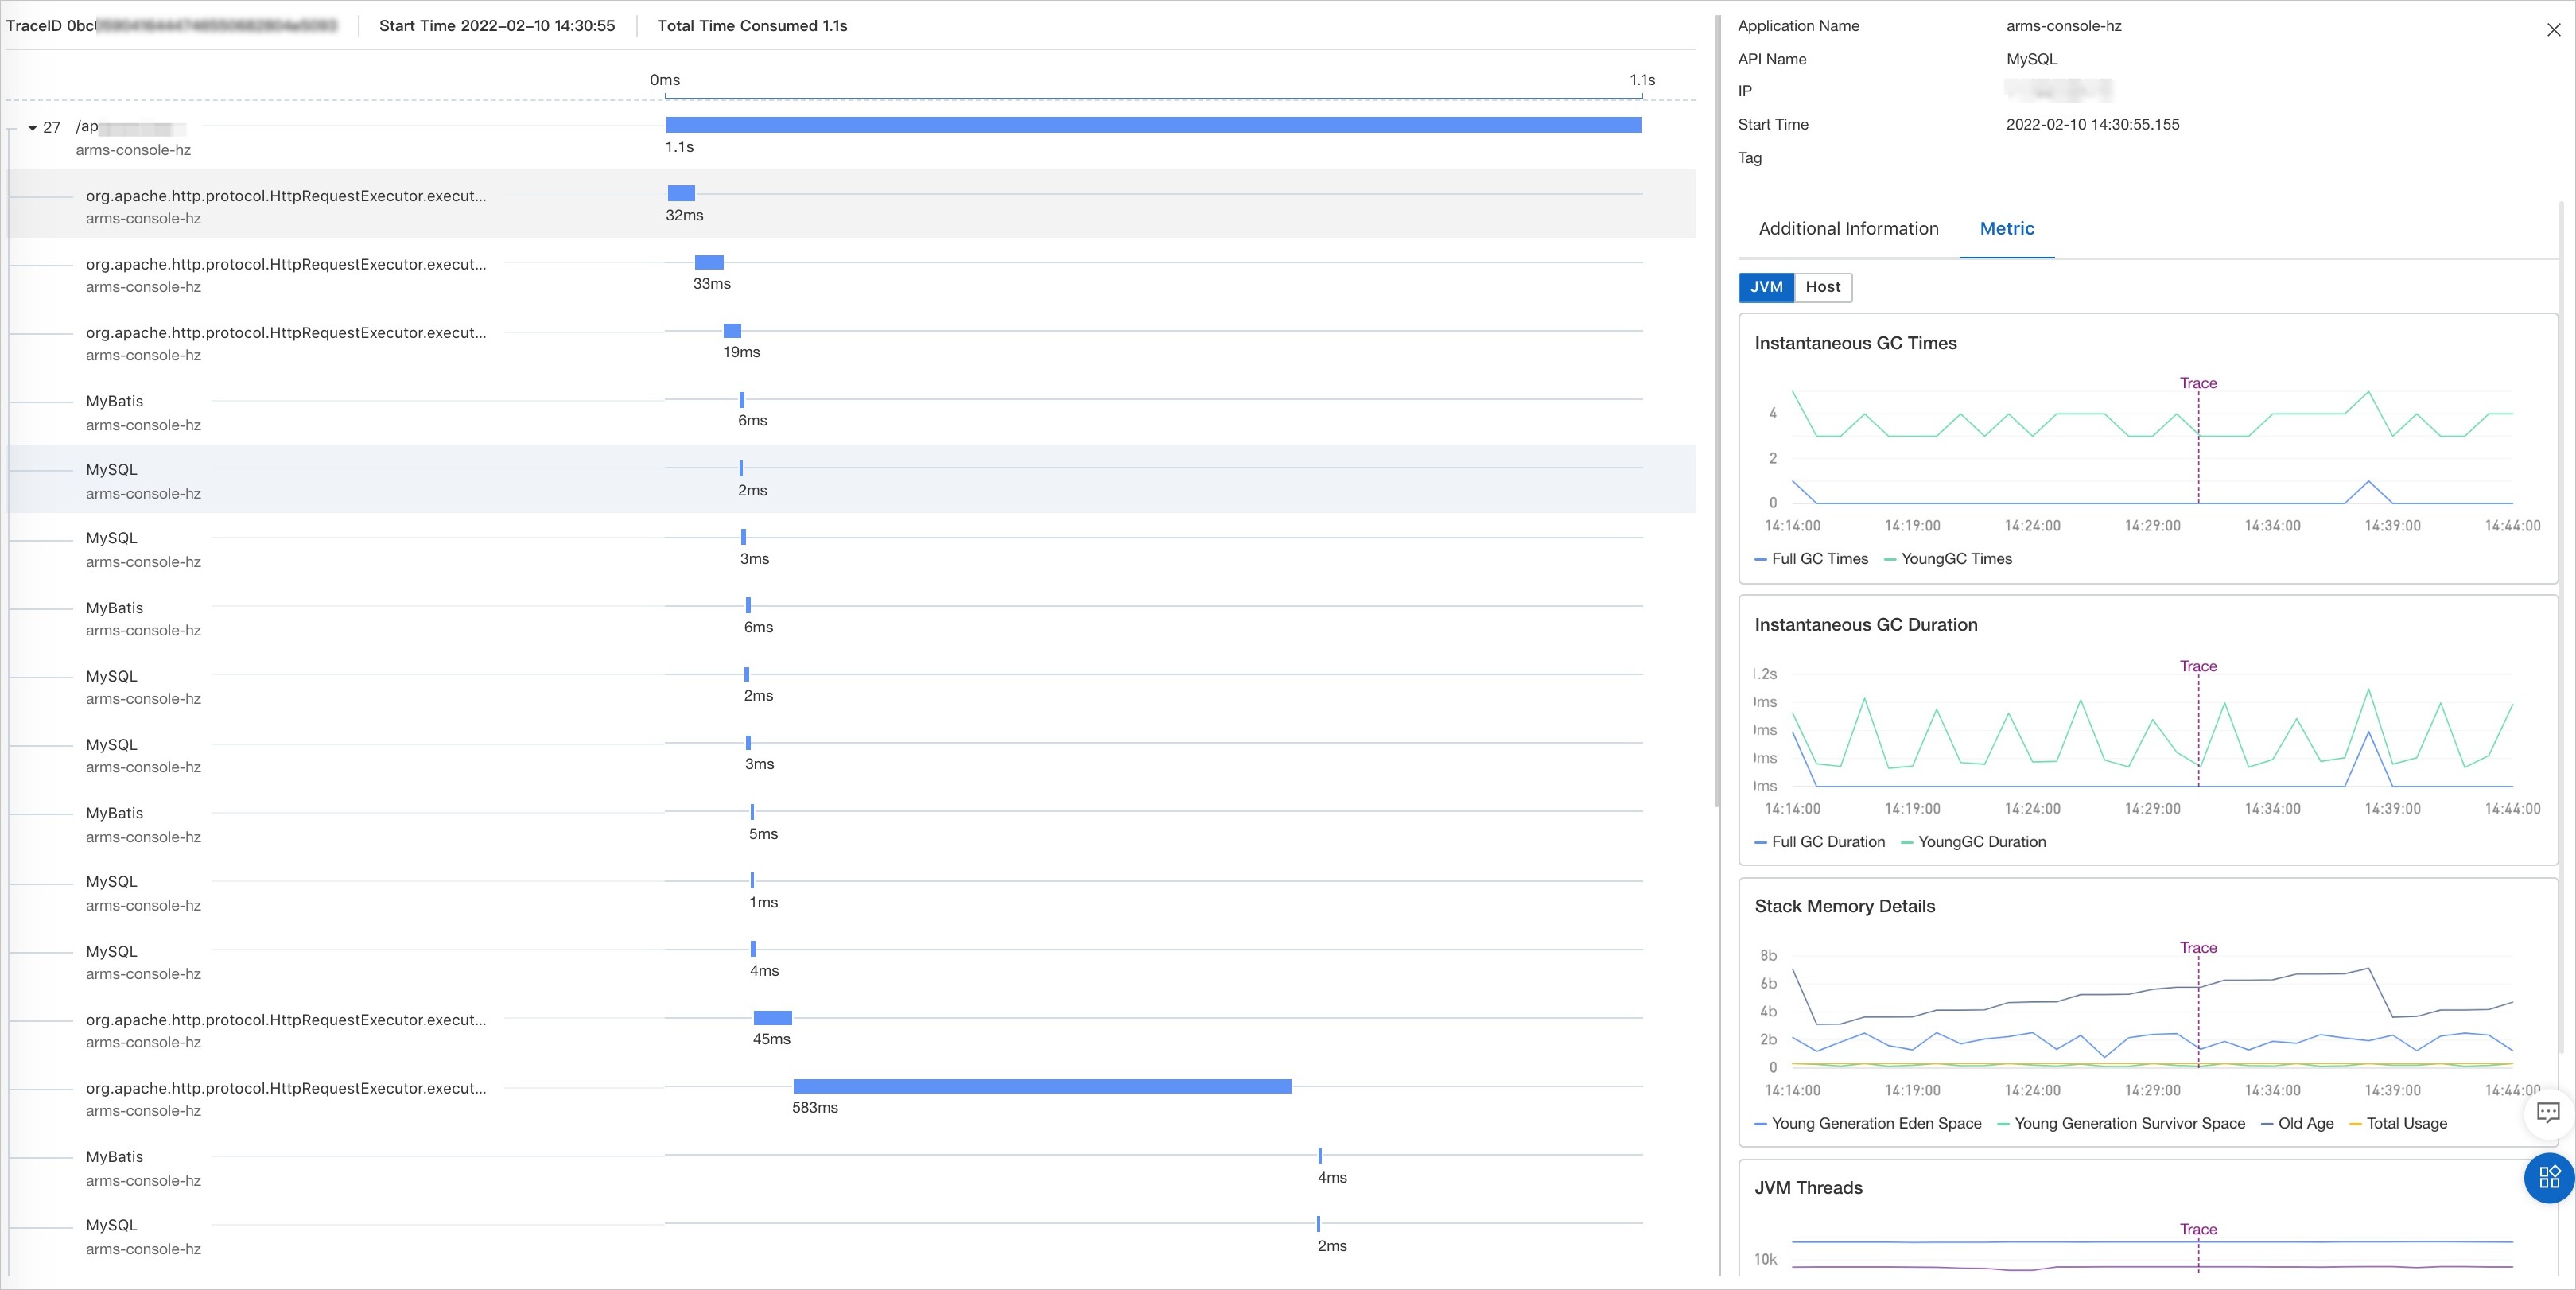
Trace details
The left side of the trace details page shows the call sequence and duration of each span. The right side displays associated metrics such as SQL queries, JVM stats, and host-level metrics.
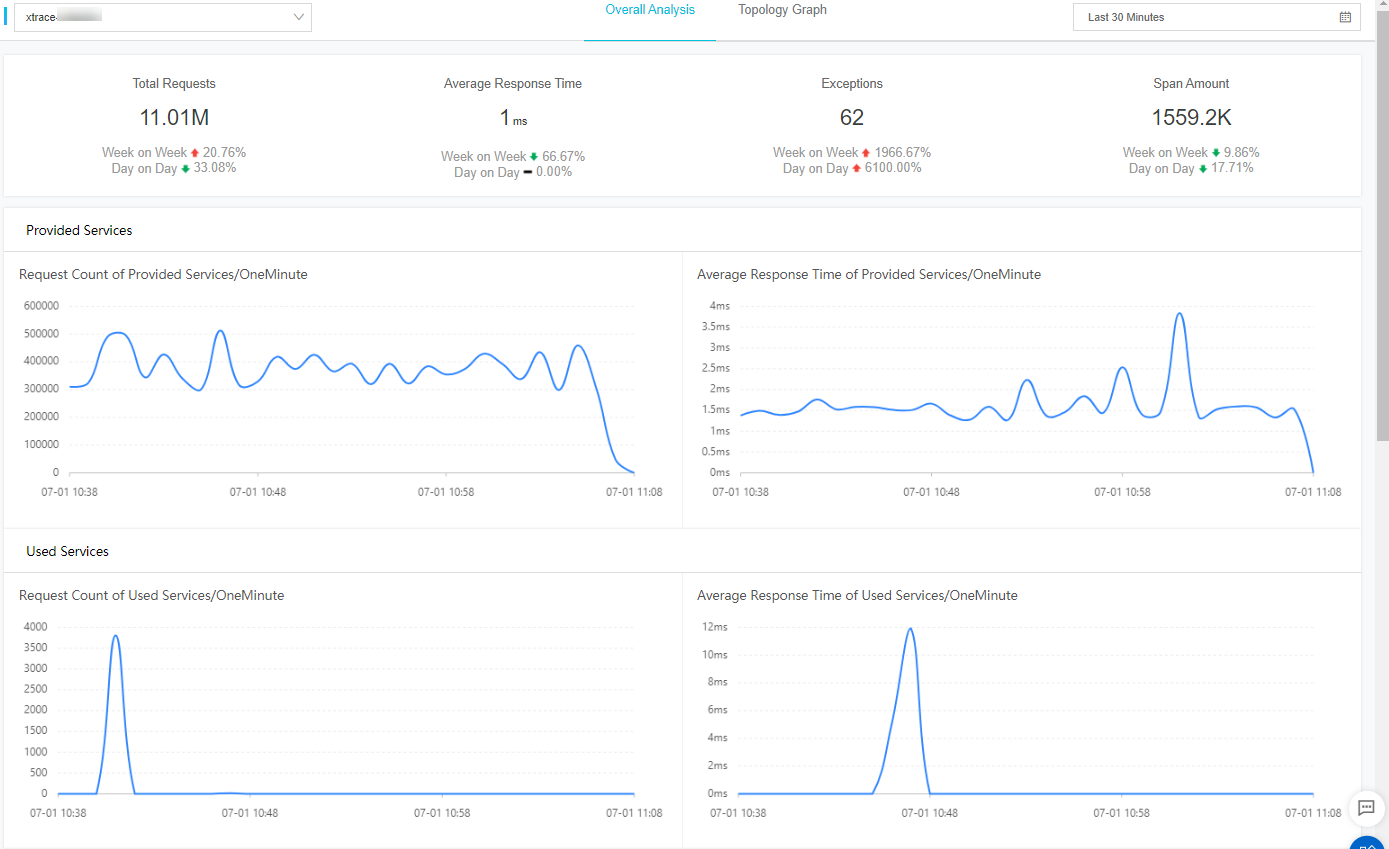
Pre-aggregated metric dashboards
ARMS automatically generates dashboards from trace data, including application overview, API call, and database query dashboards. For more information, see Application overview.
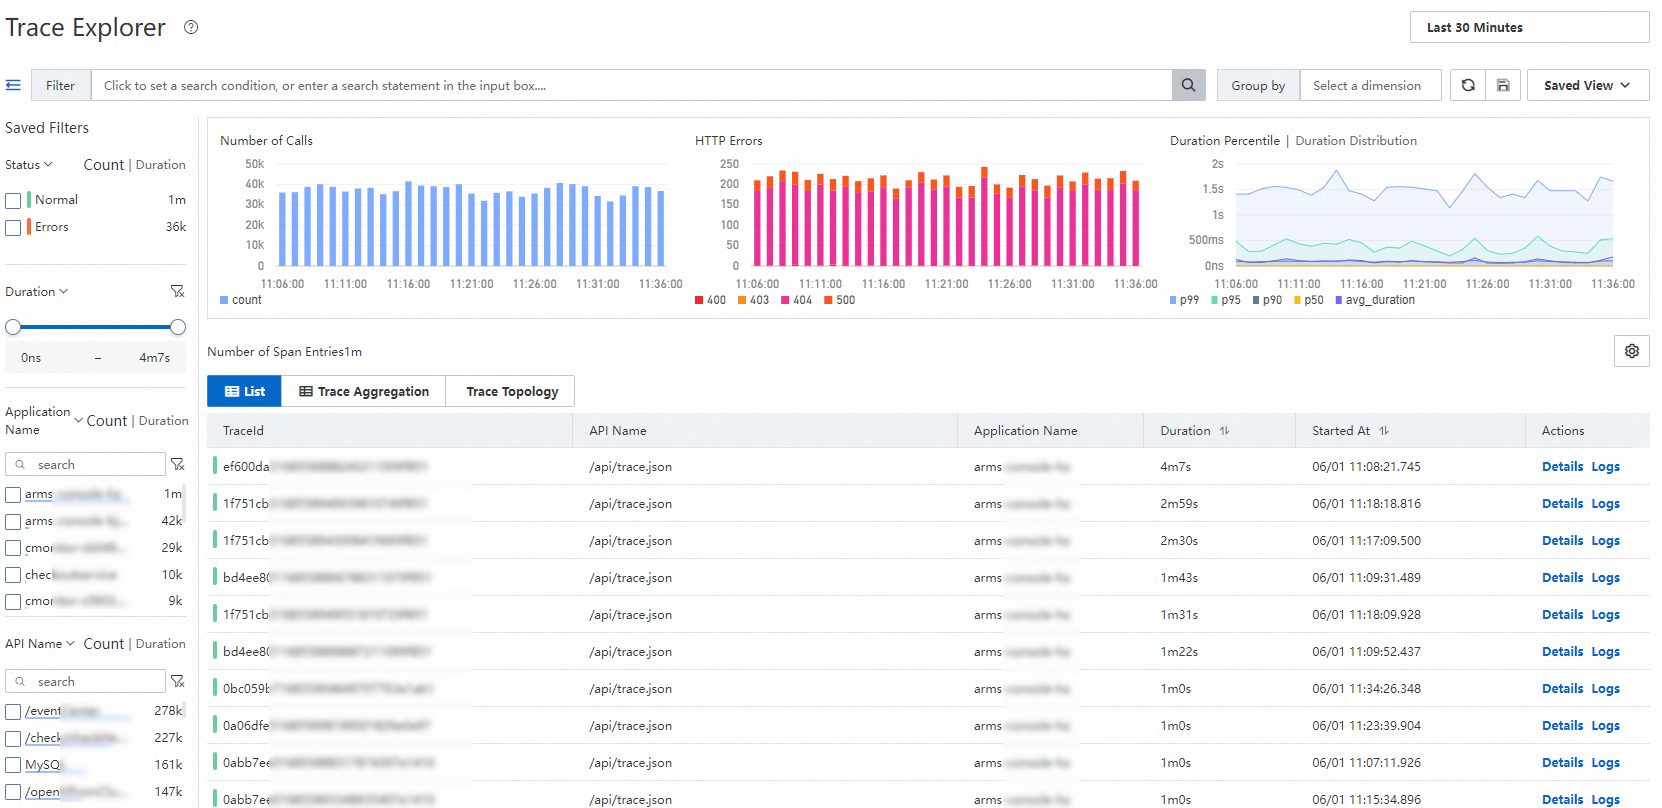
Trace Explorer
Filter and aggregate traces by multiple dimensions such as application, IP address, or API. Trace Explorer also supports querying abnormal traces across services. For more information, see Trace Explorer.
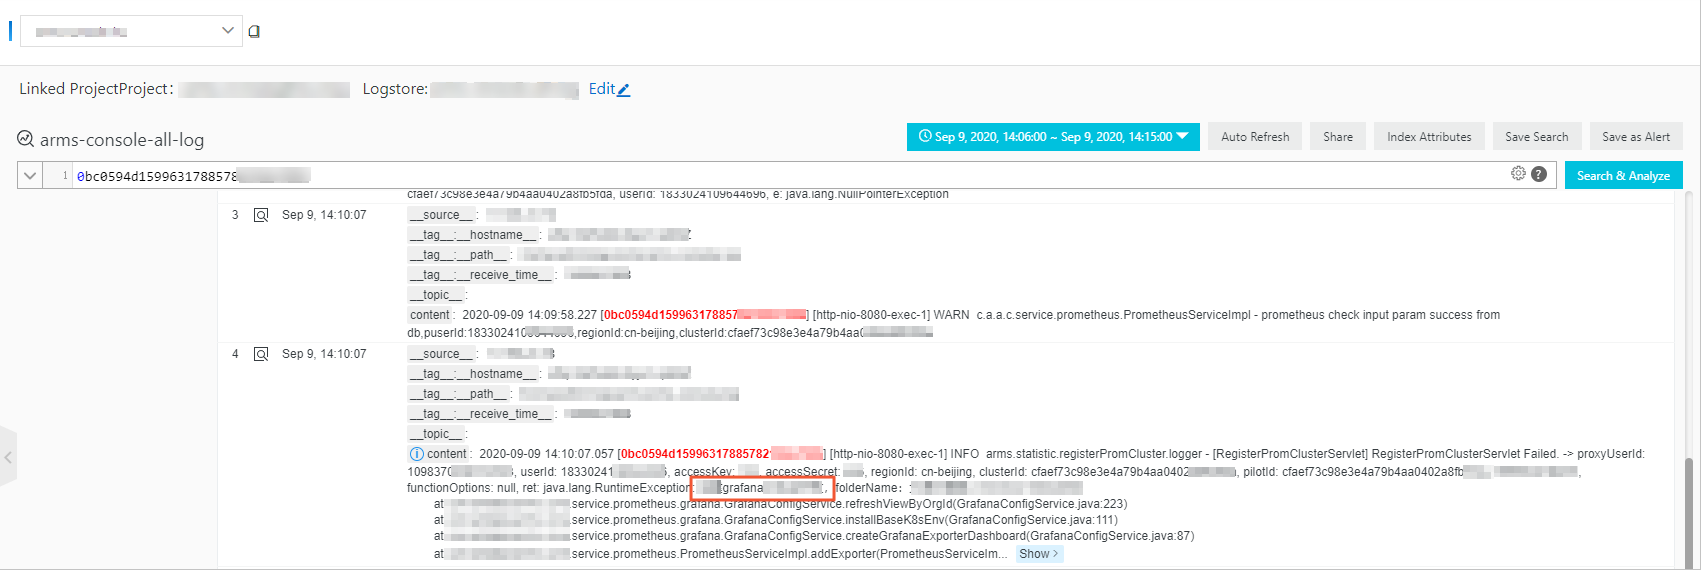
Trace-to-log correlation
ARMS links traces to service logs, so you can jump from a trace span directly to the relevant log entries when troubleshooting exceptions. For more information, see Identify business exceptions by analyzing traces and logs.