By Mengshi
PolarDB-X is a distributed database that consists of components such as CN (Compute Node), DN (Data Node), GMS (Global Metadata Service), and CDC (Change Data Capture). There are many monitoring metrics on its monitoring page. In fact, most databases provide massive monitoring metrics. It is easy to get confused if you do not have experience using the metrics. Most metrics are only useful in rare scenarios, such as some extreme troubleshooting scenarios. Usually, focusing on just a few key metrics is enough to gauge the database's operational status.
This article describes the core monitoring metrics in PolarDB-X, with some insights applicable to other databases within the MySQL ecosystem.
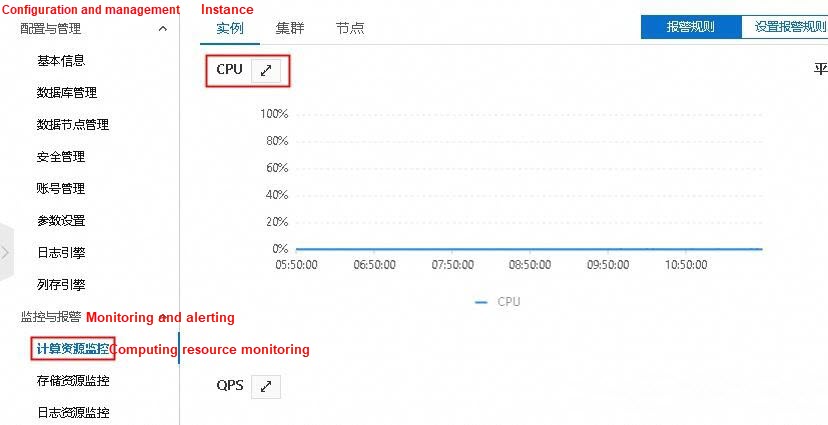
For CNs, the core resource is the CPU, and the most important metric to monitor is CPU usage (Computing Resource Monitoring -> Instance -> CPU):

If CPU resources are insufficient, it is recommended to upgrade the CN specifications or increase the CN number.
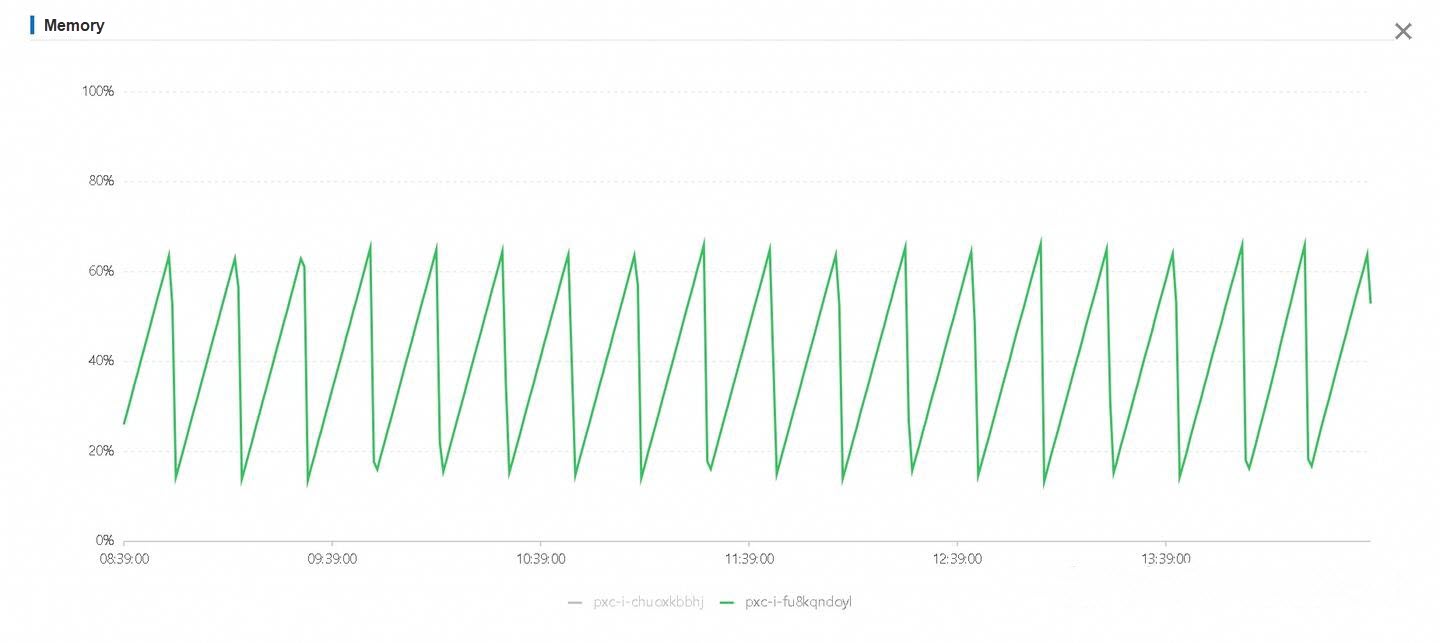
The CN of PolarDB-X is a Java-implemented program, whose memory utilization shows the usage of the OLD region in the JVM heap memory. Since Java uses a garbage collection (GC) mechanism to reclaim memory, its memory monitoring (Computing Resource Monitoring -> Cluster -> Memory) graph usually shows a zigzag pattern as follows. It is a normal situation and you do not need to worry.

Monitoring only the memory usage cannot determine if the CN has sufficient memory resources. Generally, we recommend that you combine it with the Full GC Time (Computing Resource Monitoring -> Cluster -> Full GC Time).

If you are unfamiliar with Java, Full GC is a GC behavior that occurs when the memory is insufficient. In other words, the Full GC time should always be 0 when there is sufficient memory. If this metric frequently shows non-zero values within a short period, it usually indicates that the memory is insufficient.
Here are some suggestions:
Logical QPS (Computing Resource Monitoring -> Node -> Logical QPS) refers to the QPS at the CN layer. Physical QPS (Computing Resource Monitoring -> Node -> Physical QPS) refers to the QPS at the DN layer.
For example, if an SQL statement needs to query 10 shards, it is recorded as 1 query at the CN layer and 10 queries at the DN layer. In most cases, the physical QPS is greater than or equal to the logical QPS. (In rare cases, it is the other way around. For example, some SQL statements without table names can be processed by the CN.)
QPS includes query operations and DML operations.
These two metrics are useful. Please remember the best practices in one sentence:
The performance and scalability of PolarDB-X largely depend on whether the ratio of physical QPS : logical QPS is close to 1:1.
When the physical QPS is much higher than the logical QPS, for example:
This means that most queries may not have partition keys and thus scan the full shard. If the ratio is close to 1:1, most SQL statements have an equivalent condition on the partition key.
This ratio is not necessarily equal to 1:1. Operations such as global index writes and batch inserts will increase this ratio, which is normal.
Note: In the PolarDB-X QPS, the following statements are excluded to provide data that more closely matches the user's actual experience:
1. SELECT 1, which is usually sent by the connection pool to check the liveness of connections.
2. SELLECT @@xxxxxx, @@xxxxxx, @@xxxxx, which is usually generated by the mysql-java-connector when creating a connection.
3. Transaction control statements such as commit, rollback, begin, and set autocommit=0.
4. The prepare section in the Prepare protocol.
5. Other statements that are not usually generated by the business, including but not limited to some SHOW commands. CPU is a crucial resource, so it is recommended to set up an alert item for it. When CPU resources become insufficient:
There are several metrics related to memory in the DN.
Different from the memory usage of a CN, the memory usage of a DN (Storage Resource Monitoring -> Node -> Memory Usage) refers to the ratio of the memory used by the DN process to the physical memory.
Memory in the DN is mainly used for the buffer pool (usually more than 75% of memory). Memory for the buffer pool is allocated in advance when the DN process starts and is not affected by traffic. Therefore, memory usage monitoring shows that memory usage is maintained at more than 90% for a long time. This is normal and should not be a concern (idle memory is a waste for DN).
Therefore, for the memory of DN, we directly observe the relevant monitoring of the buffer pool.
The buffer pool (Storage Resource Monitoring -> Node -> Memory Buffer Pool) monitoring graph includes three key metrics:
Among them, the most important metric is the read hit ratio of the buffer pool.
If you don't know much about the principle of the database, you just remember that SQL statements read and write all data through the buffer pool. For data that is not in the buffer pool, it needs to be read from the disk to the buffer pool before any read or write operation.
Compared with memory read and write, disk I/O is an expensive and inefficient resource. Most database optimizations ultimately aim to reduce disk I/O.
Therefore, the hit ratio of the buffer pool is an important metric that affects database performance.
Normally, the hit ratio higher than 98% is a relatively proper level. Below this value, a large number of disk I/O operations may occur.
Why does the hit ratio of the buffer pool need to be so high?
A commonly used point query SQL statement for an online business usually involves reading and writing dozens of pages (different levels of the tree, access to different indexes, and index lookup).
For example, 10,000 QPS requires hundreds of thousands of page accesses. Even if 1% of the pages generate disk I/O, thousands of disk I/Os will be generated.
However, it is not necessary to set up an alert item for buffer pool monitoring. When the buffer pool has a bottleneck, it is usually reflected in IOPS, so setting up an alert item for IOPS is sufficient.
IOPS is a core metric of disk resources. The IOPS usage (Storage Resource Monitoring -> Node -> IOPS Usage) is usually interconnected with the usage of the buffer pool.
When IOPS resources are insufficient, metrics such as CPU and active threads also increase, finally leading to slower SQL queries. SQL optimization is mostly about optimizing I/O, which will not be elaborated.
It is recommended to set up an alert item for IOPS.
There's not much to say about disk capacity. It's also recommended to set up an alert item.
The CDC is independent of the Logger node in Paxos and Raft. It is a component used to generate global binlogs. Therefore, you need to monitor this component only if you use global binlogs. For example:
The recommended monitoring items for alert setting are CPU and latency.
The following figure summarizes the monitoring items recommended for setting alerts.
| Component | Metric name in CloudMonitor | Recommended alert threshold |
|---|---|---|
| CN (Computing Resources) | CPU utilization of PolarDB-X compute nodes | 70% |
| DN (Storage Resources) | CPU utilization of PolarDB-X data nodes | 70% |
| IOPS utilization of PolarDB-X data nodes | 70% | |
| Disk utilization of PolarDB-X data nodes | 85% | |
| CDC (Change Data Capture) | CPU utilization of PolarDB-X CDC Dumper | 70% |
| Latency of PolarDB-X CDC Dumper | 10s |
Note:
Metrics that are not mentioned in this article typically do not require setting up alert rules, but it does not mean that these metrics are useless.
In scenarios such as troubleshooting, these metrics may still be of reference significance. PolarDB-X Best Practice Series (3): Use Qwen and Stored Procedures to Quickly Generate Test Data
Compaction Service: Intelligent Scheduling and Scaling within Seconds
ApsaraDB - October 24, 2022
ApsaraDB - December 12, 2025
ApsaraDB - December 22, 2025
ApsaraDB - April 20, 2023
ApsaraDB - April 16, 2025
ApsaraDB - November 19, 2025
 Best Practices
Follow our step-by-step best practices guides to build your own business case.
Learn More PolarDB for Xscale
Alibaba Cloud PolarDB for Xscale (PolarDB-X) is a cloud-native high-performance distributed database service independently developed by Alibaba Cloud.
Learn More PolarDB for MySQL
Alibaba Cloud PolarDB for MySQL is a cloud-native relational database service 100% compatible with MySQL.
Learn More .COM Domain
Limited Offer! Only $4.90/1st Year for New Users.
Learn MoreMore Posts by ApsaraDB