By Colince Azeye, Alibaba Cloud Tech Share Author. Tech Share is Alibaba Cloud's incentive program to encourage the sharing of technical knowledge and best practices within the cloud community.
When it comes to checking for what is going on through your network, or checking if some configurations you did are OK, you may be easily overwhelmed with the abundance of information. Knowing what you are looking for will keep you safe and efficient. To know what you are looking for when you are using a network analyzer, you need some basic understanding on network before knowing how to use the tool. In this tutorial, after explaining the basics of networking, we are going to see how to use Wireshark, one of the best protocol analyzer to monitor our traffic.
Obviously, if we want to talk about networking in detail, we won't be able to cover it here, but we are going to briefly talk about the network protocol that make the world goes round: TCP/IP.
A protocol is a set of rules and procedures for how systems interact with one another. The TCP/IP protocol is a set of rules and procedure used to transmit data from one computer to another. Whether you're system administrator, security engineer, forensic investigator, network engineer, understanding these protocol is necessary if you want to be efficient. TCP/IP is the most common protocol used on the internet for communication.
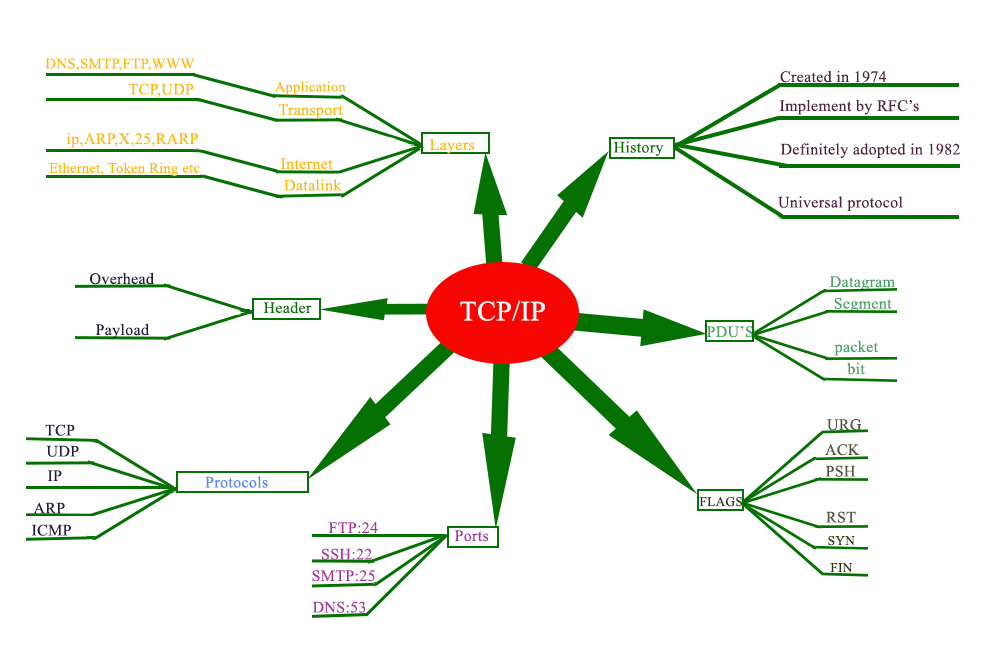
TCP/IP protocol
The image above summarize all what TCP/IP is.
1- History
TCP/IP created by Vinton Gray "vint" Cerf and Robert Elliot Kahn in 1974, implemented by RFC's( Request For Comment) definitely adopted in 1982. It is not own by any organisation that's make it a universal protocol.
2- Layers
Instead of OSI model that describes network protocol in 7 layers, TCP/IP combine several layers into a single layer therefore it has 4 layers
3- Protocol
4- Port
Ports are use to access the right services on the devices ( server, desktop , etc). Let's say that IP address allow you to access the right computer and port allow to access the right services on that computer. We have some standard services such as web services(www) running on port 80, ftp running on port 21, dns running on port 53, etc.
5- Flags
Flags are used within the TCP packet transfers to indicate a particular connection state or provide additional information. They can also be use for troubleshooting purpose or to control how a particular connection is handled.
6- PDUs
PDU is single unit of information transmitted among peer entities of a computer network. He is composed of protocol specific control information and user data. By simple way we can say that PDU is user data + header encapsulation for the layer.
7- Header
The header allow you to know who is sending the packet and where it is going.
Now that we have a basic understanding of tpc/ip protocol we can use wireshark to monitor ours traffics
For this tutorial, I have already set my FTP server online using Alibaba Cloud Elastic Compute Service (ECS).
Wireshark can be used to monitor your traffic from your computer to another computer (online server, computer on the same network) or use to monitor all traffic on the network.
There are two way to use Wireshark
In this case, imagine you want to know what is going on your server but don't have time at the moment. You can install and start tcpdum to save all network traffic history in a file so you can analyze it after when you are free.
For example, I have configure my FTP server on my ECS instance and created rule to allow me connect on port 21 so I can make a non encrypted connection on my server.
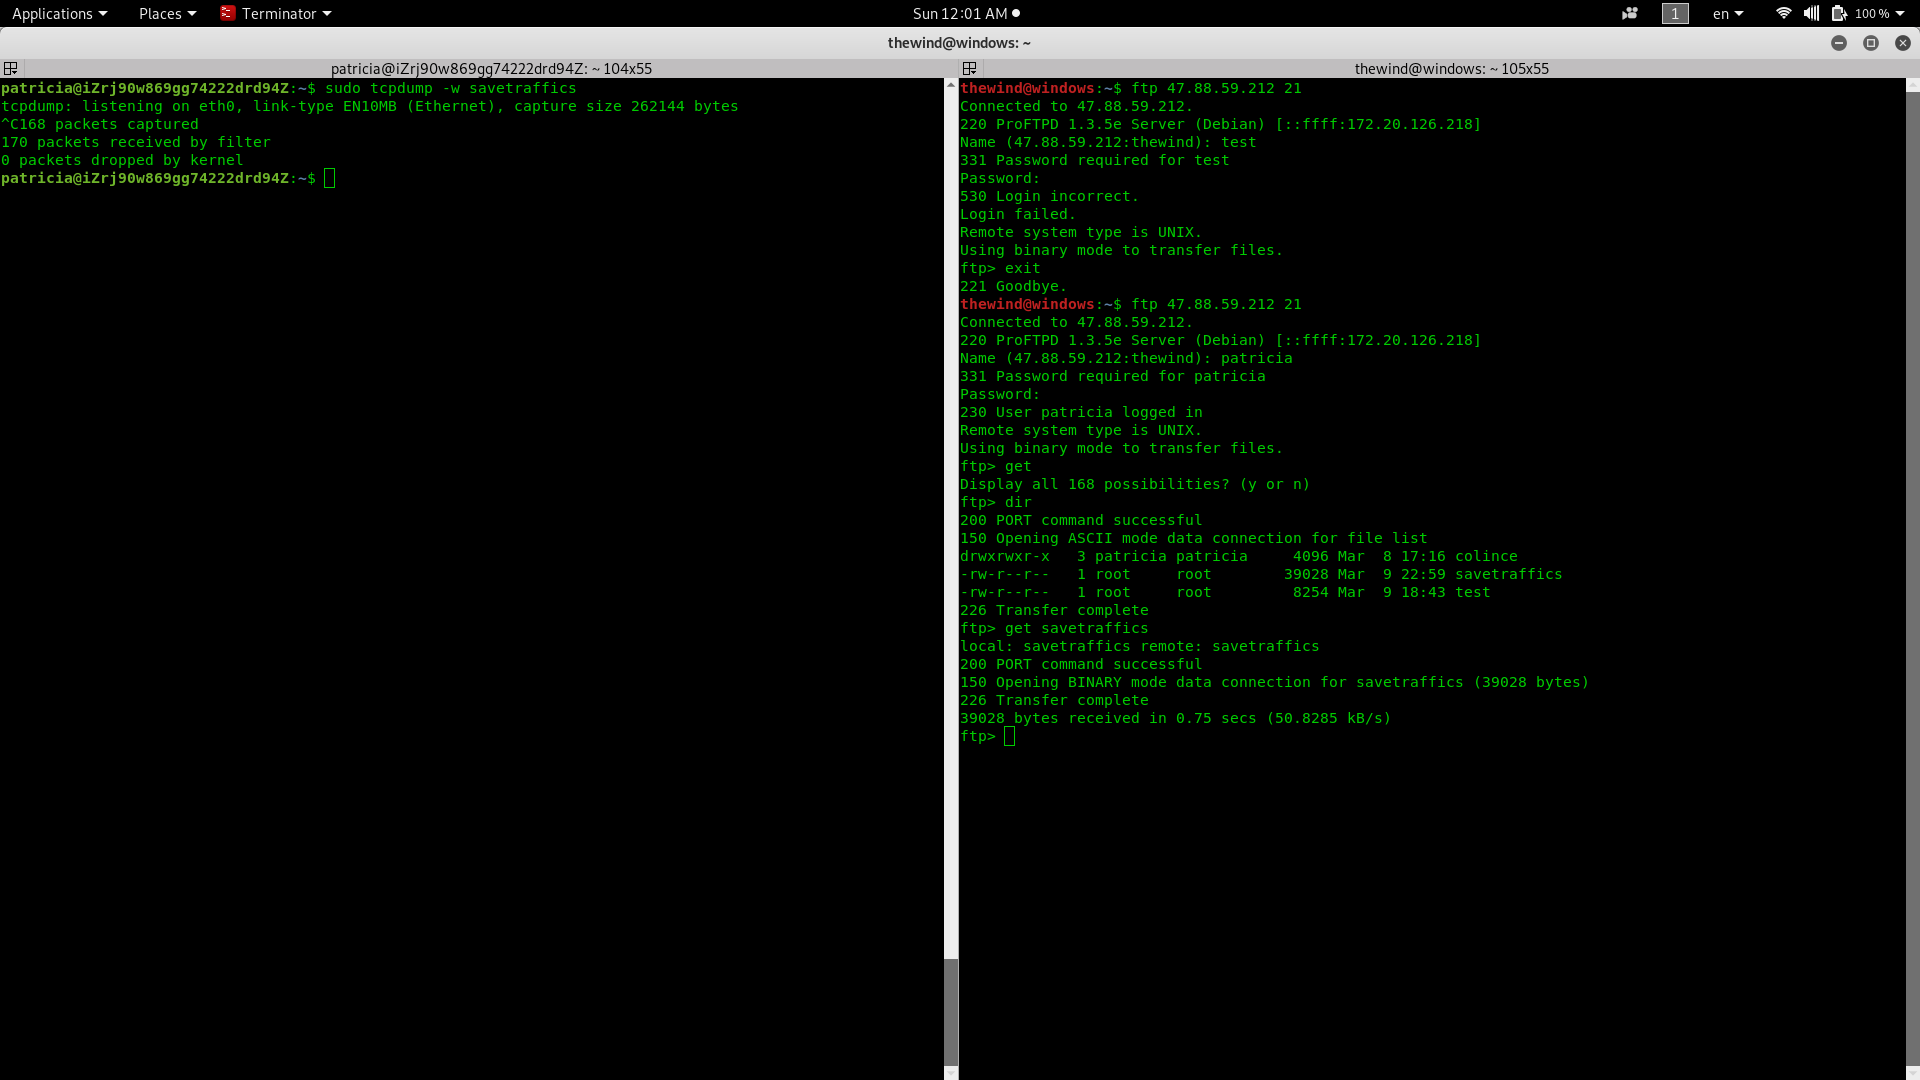
On the left side of the above image, my server is capturing traffic and saving it in a file name "savetraffics" that I will analyze afterwards with Wireshark. In the right side of the image, I have connected to my server by FTP on port 21, which is a non protected traffics. After that, I download the savetraffics on my desktop to further analyzing. So let's open it with wireshark and see what was going on in the server at that time.
To start wireshark, you can just enter the command "wireshark" if you are on Linux distribution or just double click and start wireshark if you are on windows.
Once wireshark has started, to import our file, click on file on the left corner then click open, a page will appear asking you where you file you want to import is locate. Navigate where you file is locate and select the file, or if you on the location already just enter the file name and click to open the file.
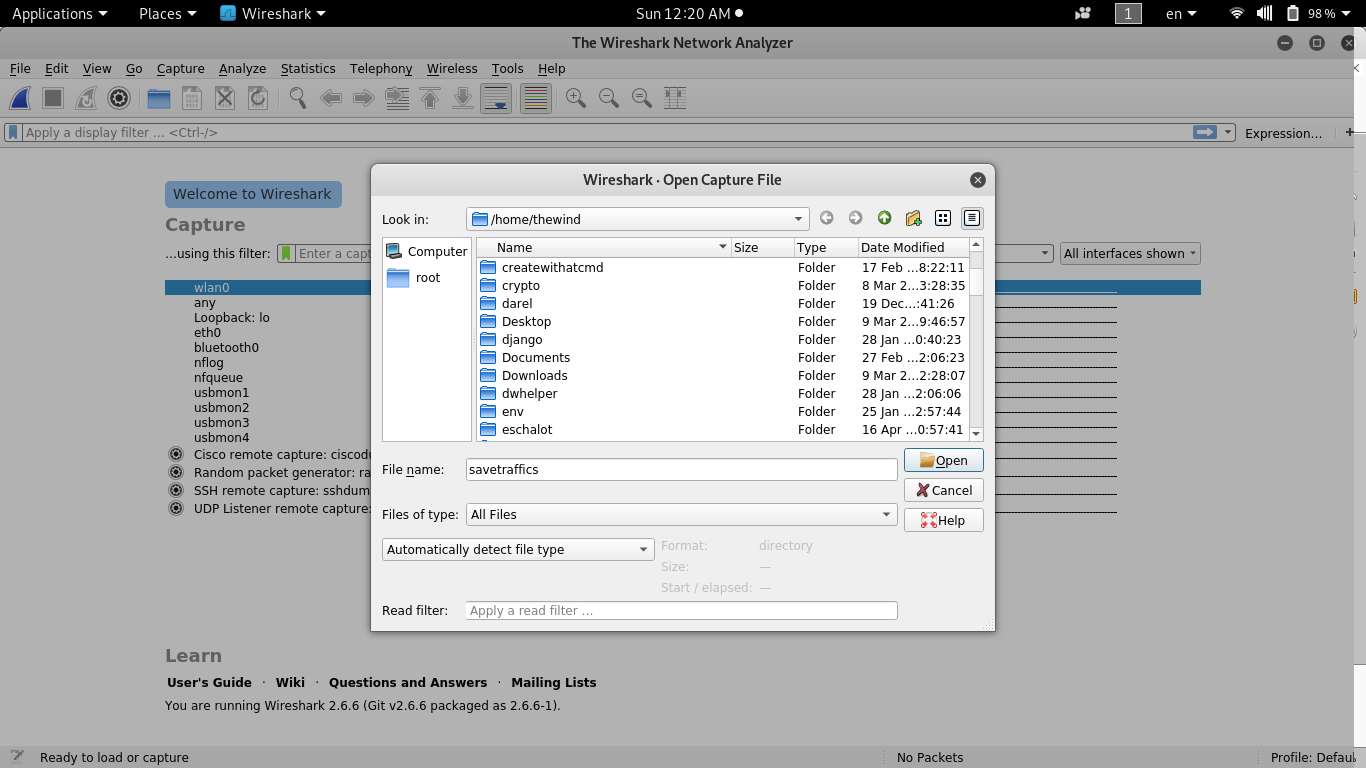
The image above shows the importing process of my save traffics file that I have captured in my online server on wireshark.
Now that I have import my file I can analyze it to see what was going on on my server.
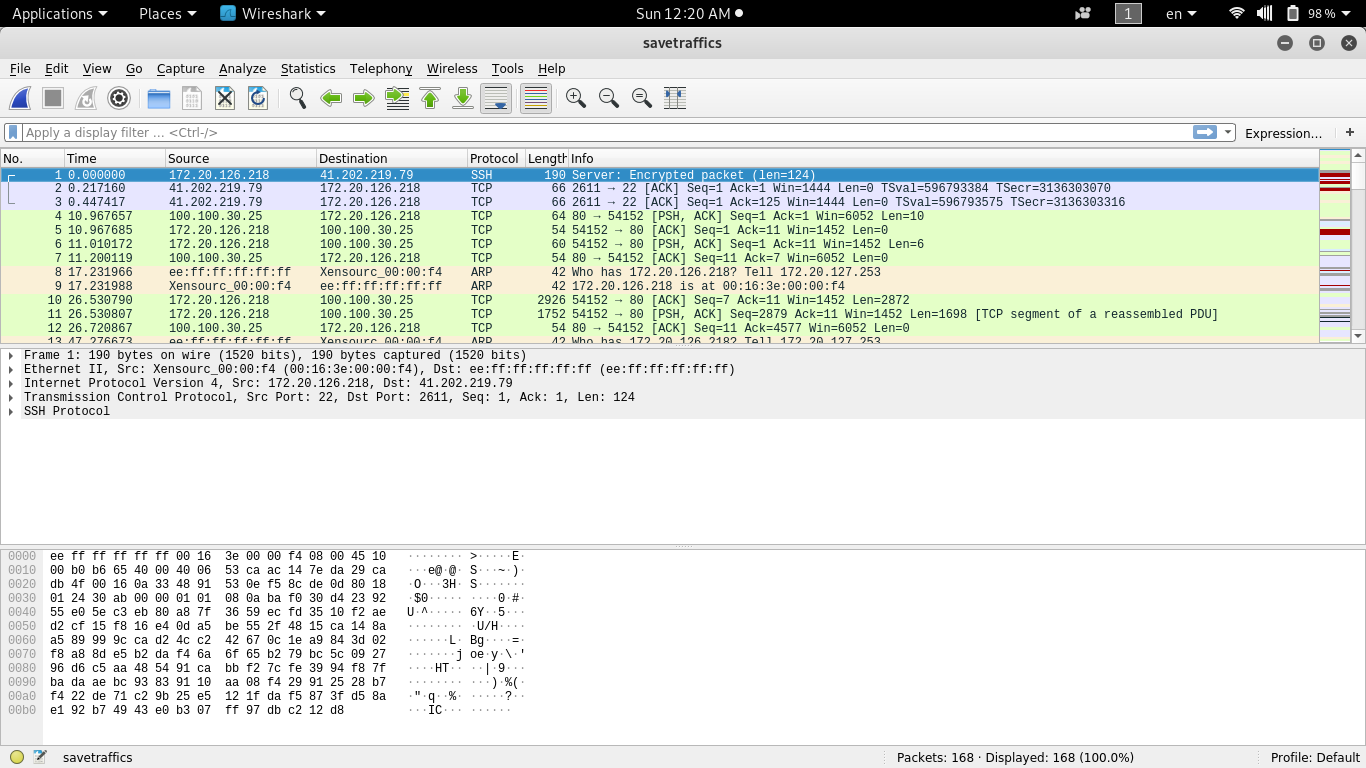
The image above shows the contents of my saved traffics file.
Before analyzing our file let see some important fields in wireshark.
We have
If I scroll down, I will see my username and password entered when login into my ftp server.
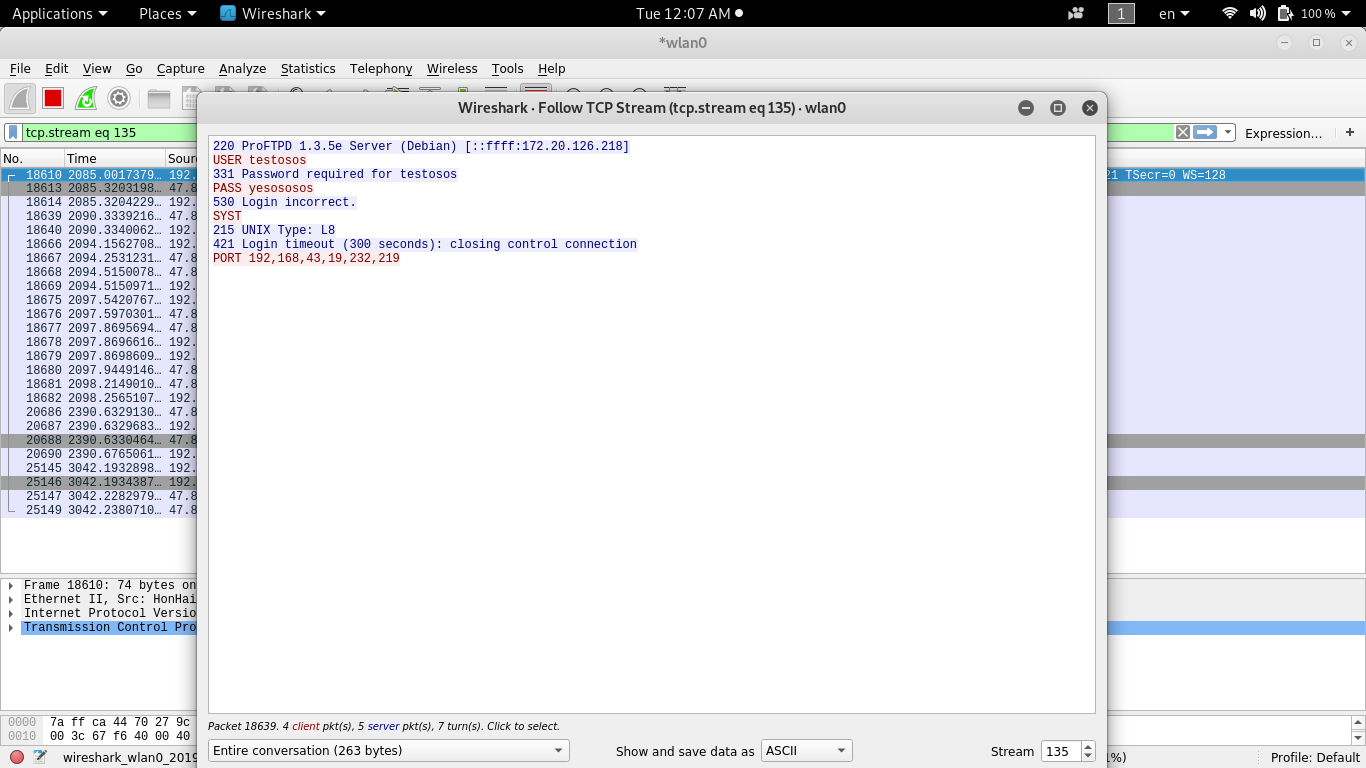
In the screenshot when login, I first enter wrong credentials. In the image bellow we are seeing that we can see that some one try to connect on our ftp server and the login was incorrect. So if after analyzing packets I see that the same source IP address have try many time with different credentials I can conclude that I maybe a password brute-force attack.
When you start your wireshark for active traffic monitoring, you first have to chose the network interface where you want listen to your traffic. After that, you can click on the blue icon at the left corner to start.
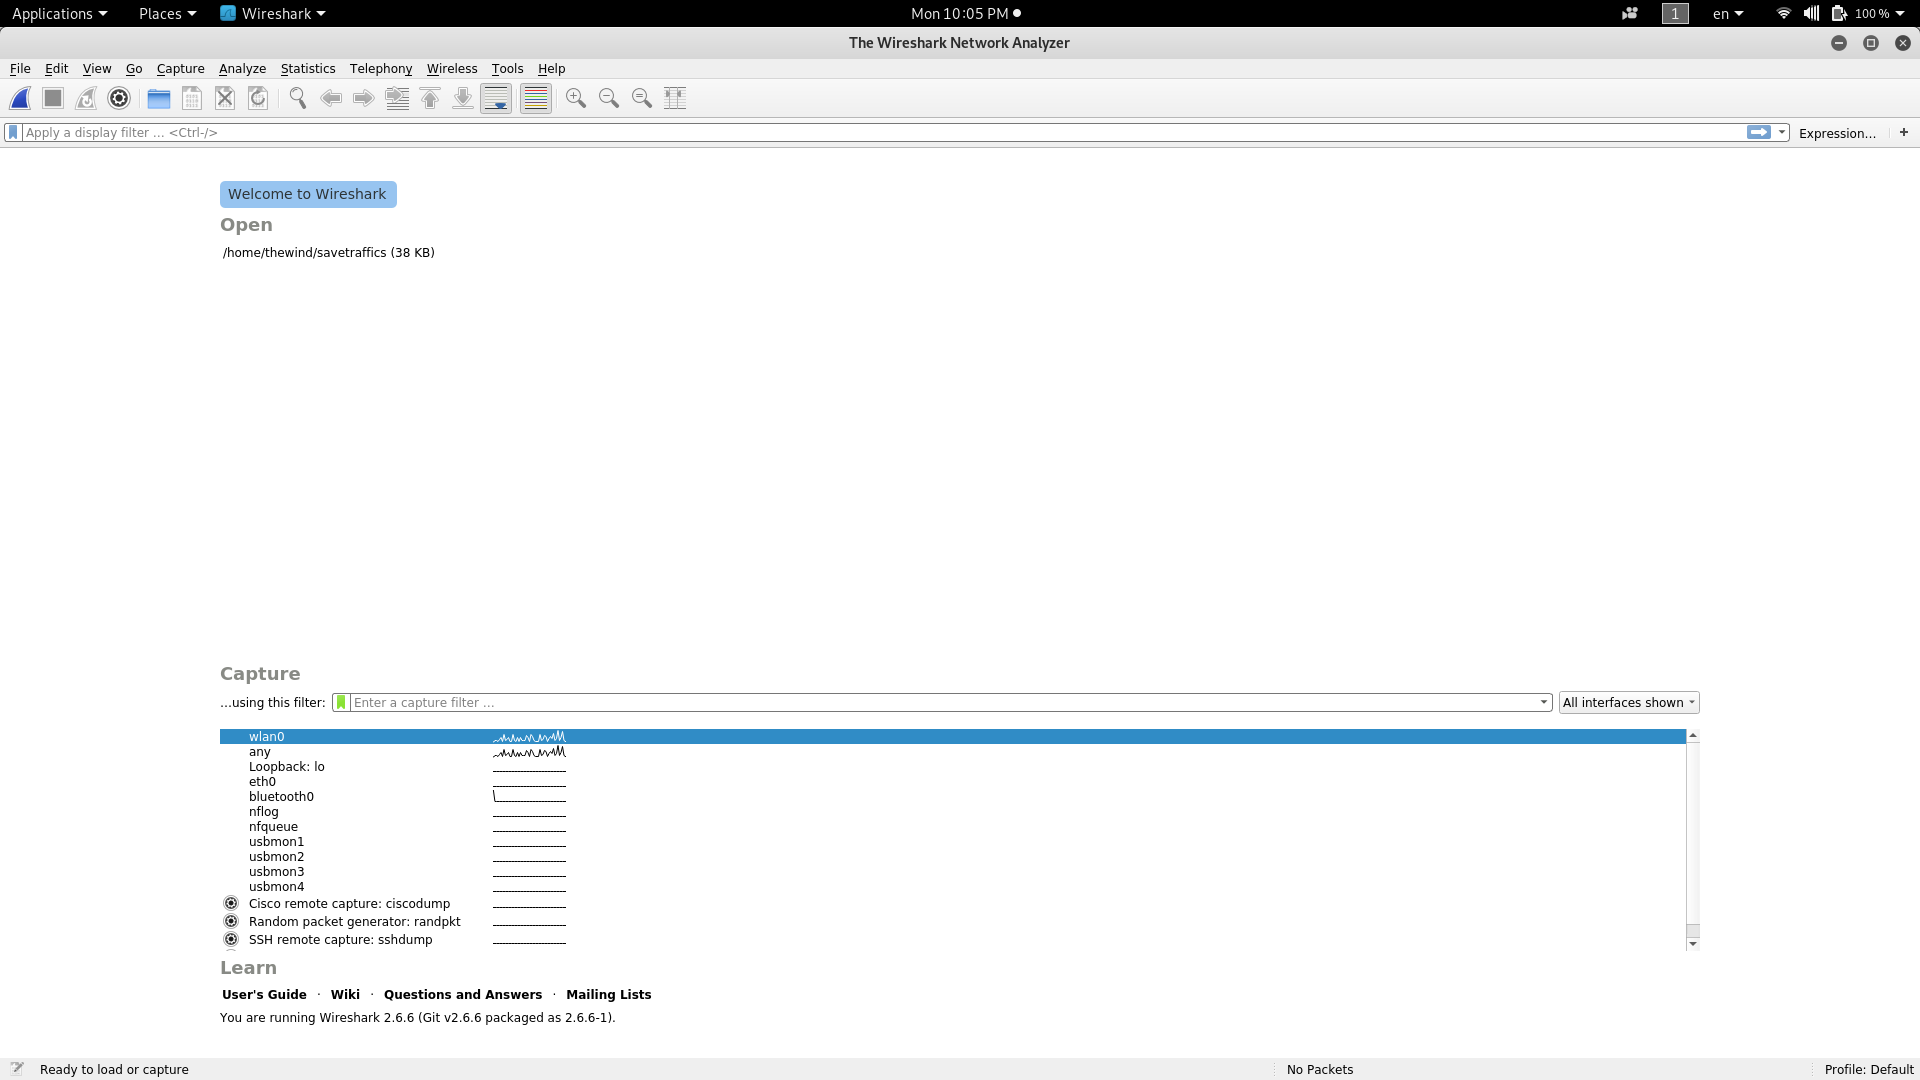
When you start your wireshark, you will be quickly overwhelm with information; knowing some wireshark features will save you for headache. So let's see some wireshare features for quick traffics analyzing.
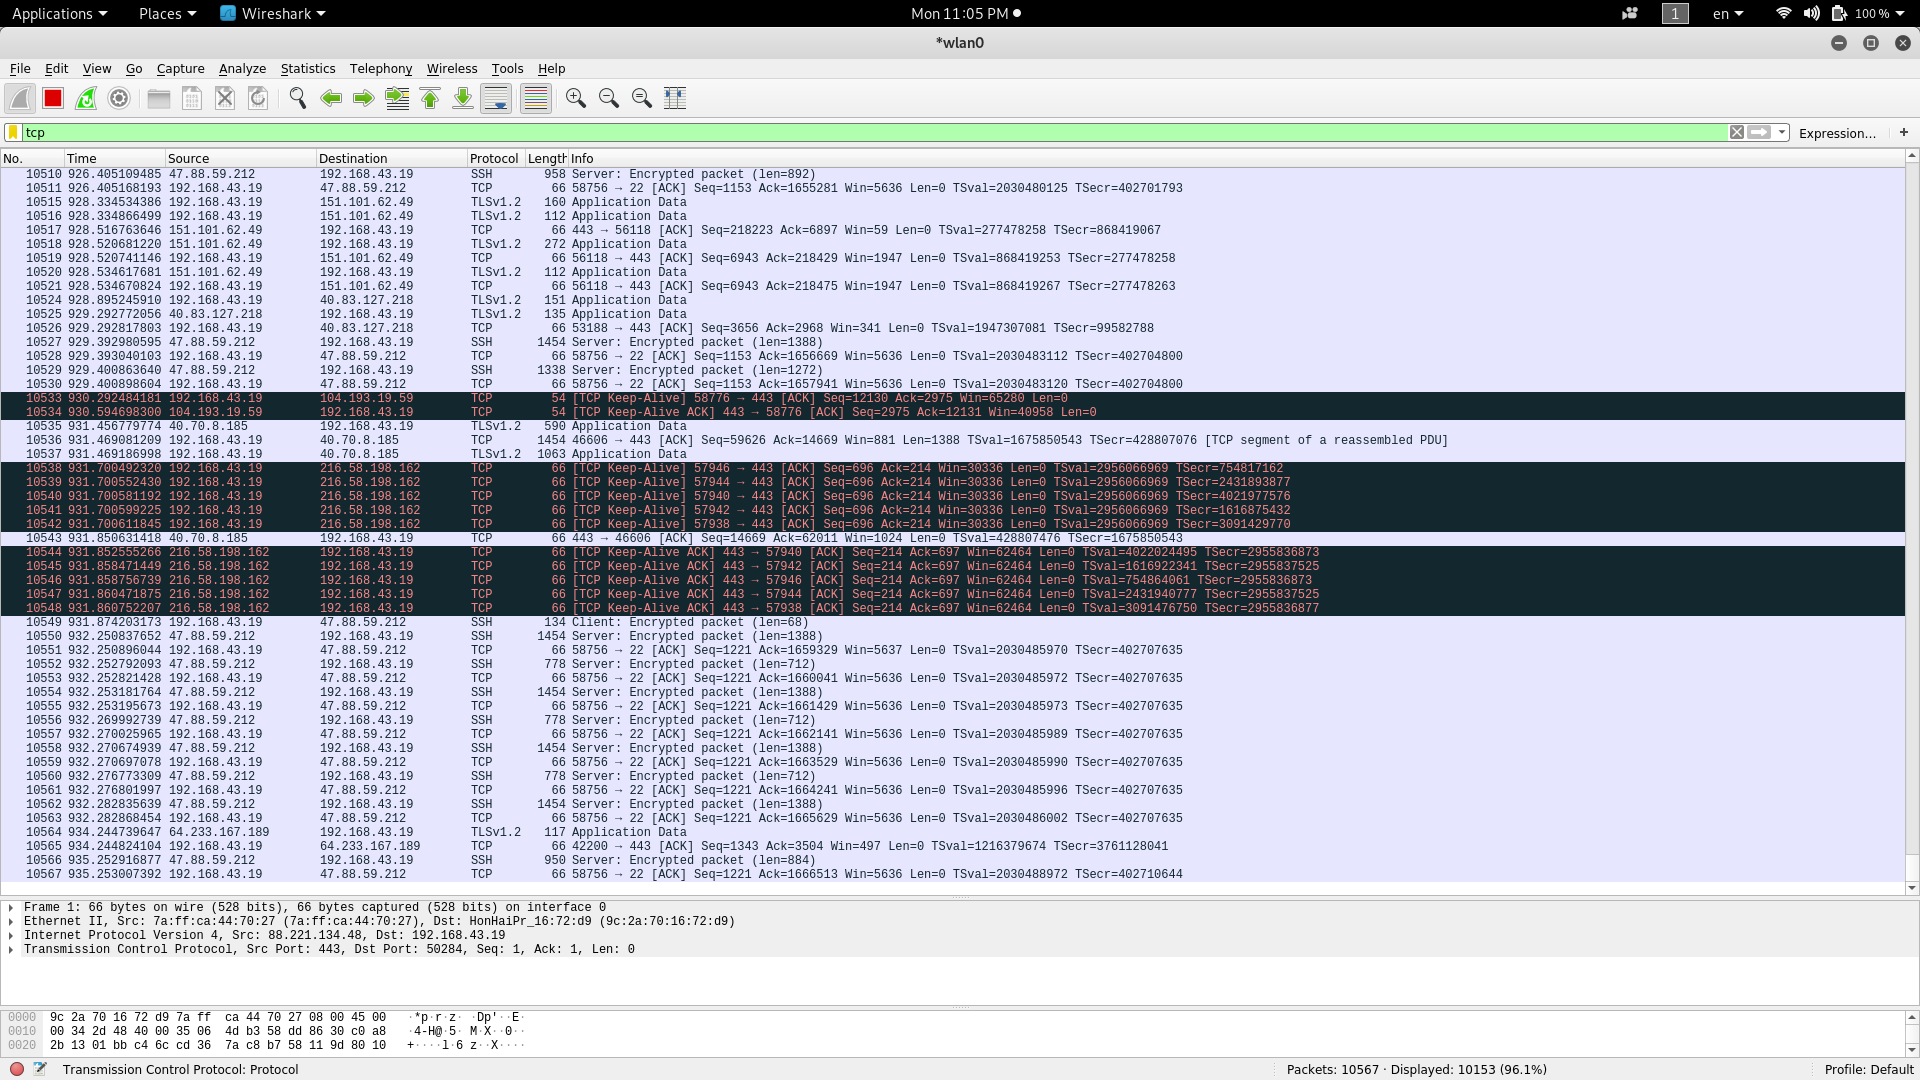
Filter are wireshark features allowing to concentrate on the packets you are interested.
Let's say we want to filter only TCP packets.
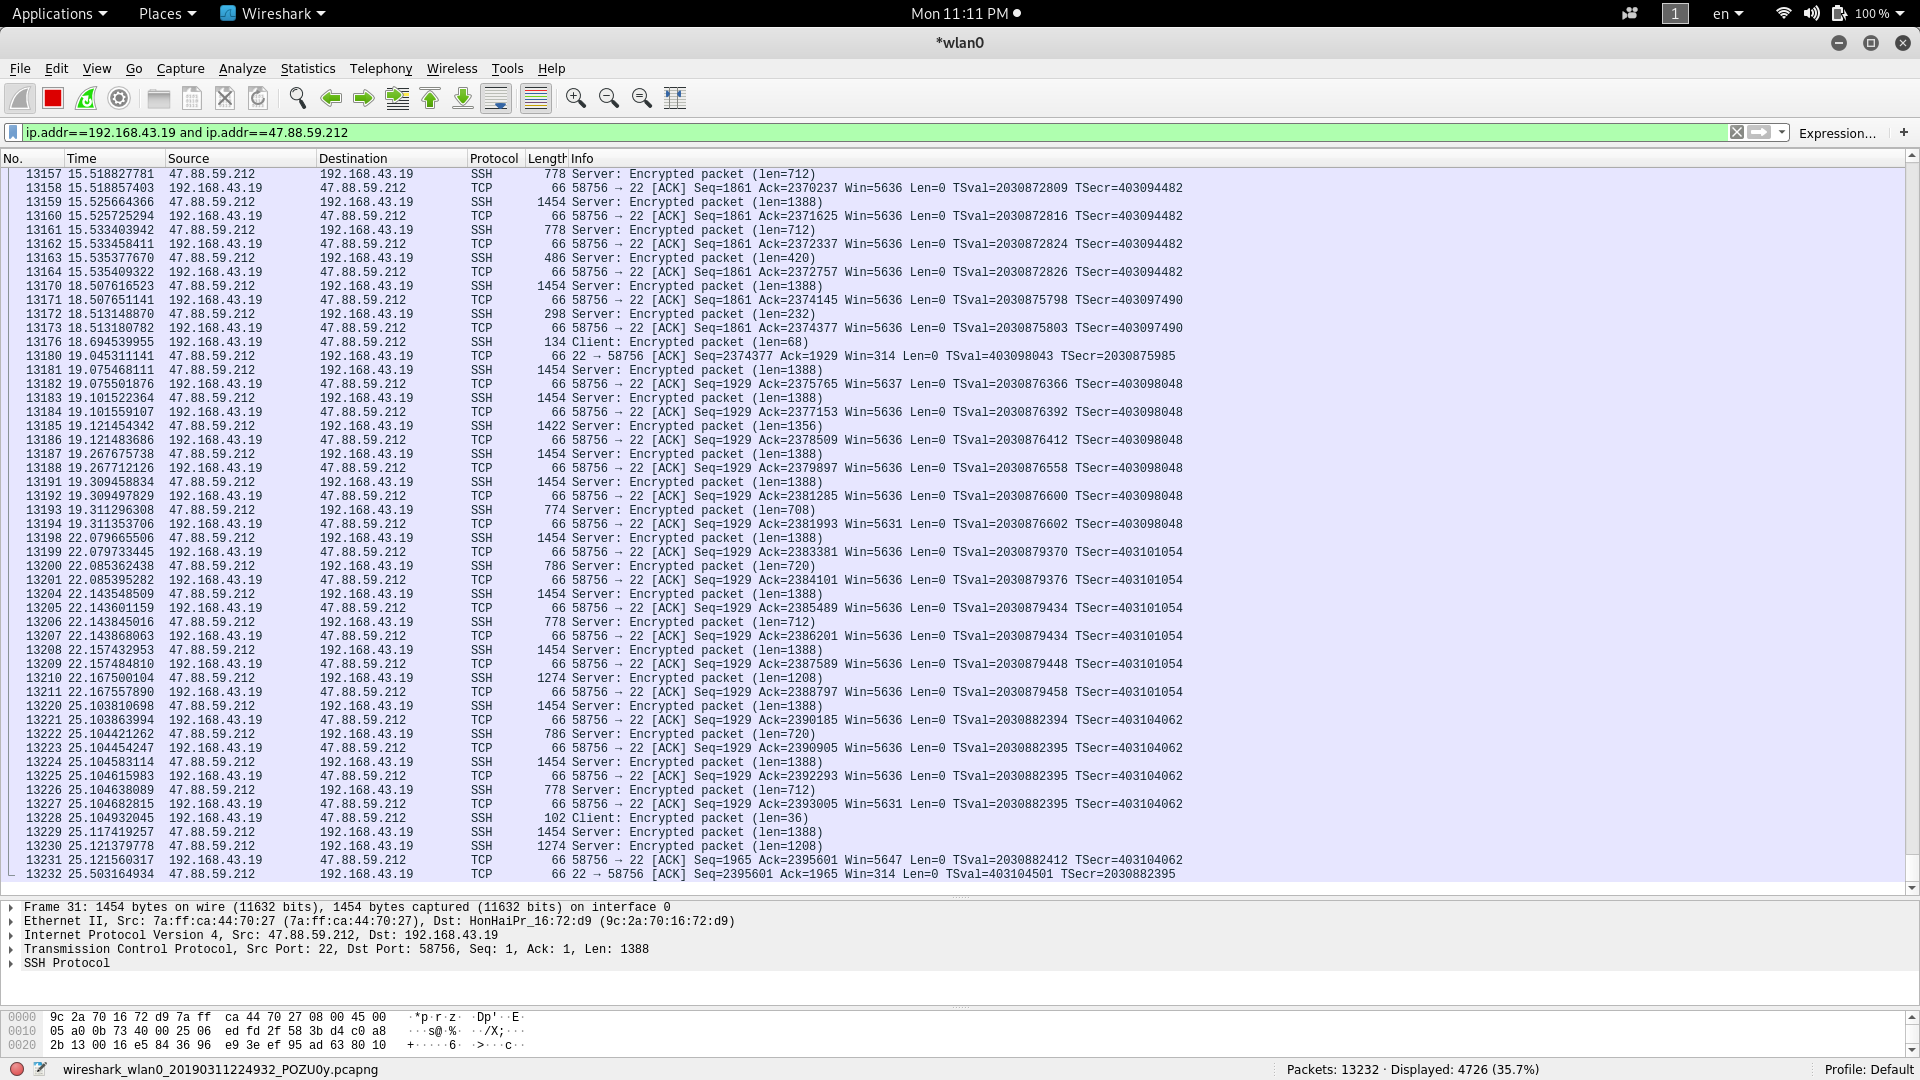
Now imagine you want just packets between your server and your desktop computer. The filter will be something like this: ip.addr== your_ip_addr and ip.addr== your_server_ip.
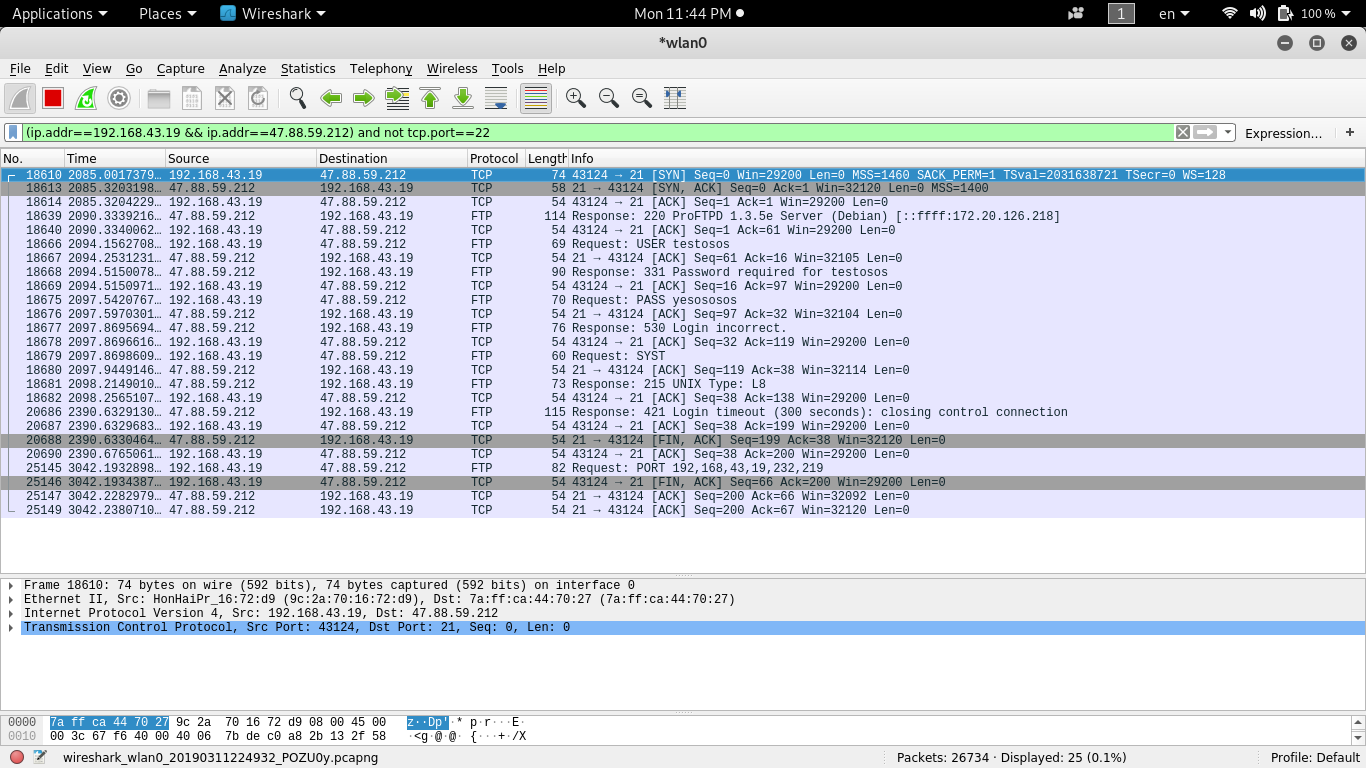
Now imagine you don't need packet from ssh, you will have something like this:
(ip.addr== your_ip_addr and ip.addr== your_server_ip.) and not tcp==22.
Let's finish with another filter. If we want to see all connections (80, 21, 22), then the filter can be something like this:
(ip.addr==192.168.43.19 && ip.addr==47.88.59.212) and tcp.port in {22 80 21}.

Following a stream can allow you to see in real time packets flow. To start a stream follow, click on analyze, click on follow then click on TCP stream to start. A box will appear and you will watch data flow in real time.
We have quickly learned about TCP/IP and have seen how we can use one of the most network analyzer tools to monitor our network. But there's still a lot more to discover with Wireshark. I highly encourage you to install it on your ECS server and explore its various features to see what is going in our network and protect your ECS server if necessary.

2,593 posts | 794 followers
FollowDikky Ryan Pratama - May 22, 2023
GXIC - February 20, 2020
Alibaba Clouder - February 2, 2018
Alibaba Clouder - March 19, 2020
Alibaba Clouder - January 31, 2019
Tim Chen - May 22, 2019

2,593 posts | 794 followers
Follow CloudMonitor
Automate performance monitoring of all your web resources and applications in real-time
Learn More ECS(Elastic Compute Service)
Elastic and secure virtual cloud servers to cater all your cloud hosting needs.
Learn MoreMore Posts by Alibaba Clouder