By Hitesh Jethva, Alibaba Cloud Community Blog author.
There are many monitoring tools available in the market including, Nagios, Zabbix, Icinga and many more. But, all these tools are heavy and difficult to use for new users. Ganglia is an easy-to-use, free, open source and scalable distributed monitoring system that can be used for high-performance computing systems such as clusters and Grids. It uses XML for data representation, XDR for compact, portable data transport, and RRDtool for data storage and visualization. You can see live or recorded statistics of CPU load averages or network utilization for many servers. Ganglia has a built-in web interface that is optimized for mobile devices, and also allows you to export data in .csv and .json formats.
In this tutorial, we will learn how to install and configure Ganglia on an Alibaba Cloud Elastic Compute Service (ECS) Ubuntu 18.04 server.
Create a new ECS instance and connect to your instance as the root user.
Once you are logged into your Ubuntu 18.04 instance, run the following command to update your base system with the latest available packages.
apt-get update -yFirst, you will need to install Apache web server, MariaDB database server, PHP and other required packages to your server. You can install all of them by running the following command:
apt-get install apache2 mariadb-server php7.2 libapache2-mod-php7.2 php7.2-mbstring php7.2-curl php7.2-zip php7.2-gd php7.2-mysql php7.2-curl php7.2-mcrypt unzip wget -yOnce all the packages are installed, start the Apache and MariaDB service and enable them to start on boot time with the following command:
systemctl start apache2
systemctl enable apache2
systemctl start mariadb
systemctl enable mariadb
Once you are finished, you can proceed to the next step.
You can install Ganglia with other components by running the following command:
apt-get install ganglia-monitor rrdtool gmetad ganglia-webfrontend -yOnce all the packages are installed, you can check the status of Ganglia monitor with the following command:
systemctl status ganglia-monitorYou can also check the status of gmetad with the following command:
systemctl status gmetadFirst, you will need to edit gmetad.conf file and define your master node. You can do this with the following command:
nano /etc/ganglia/gmetad.confMake the following changes:
data_source "my cluster" 50 192.168.0.106:8649Save and close the file, when you are finished. Then, open gmond.conf file.
nano /etc/ganglia/gmond.confMake the following changes:
udp_send_channel {
  host = 192.168.0.106
  port = 8649
  ttl = 1
}

/* You can specify as many udp_recv_channels as you like as well. */
udp_recv_channel {
/*  mcast_join = 192.168.0.106 */
  port = 8649
/*  bind = 192.168.0.106 */
}

/* You can specify as many tcp_accept_channels as you like to share
   an xml description of the state of the cluster */
tcp_accept_channel {
  port = 8649
}
Save and close the file, when you are finished.
Next, you will need to copy the Ganglia configuration file to the Apache virtual host directory. You can do it with the following command:
cp /etc/ganglia-webfrontend/apache.conf /etc/apache2/sites-enabled/ganglia.confFinally, restart ganglia monitor, gmetad and apache service with the following command:
systemctl restart ganglia-monitor
systemctl restart gmetad
systemctl restart apache2
You can verify the status of Apache service with the following command:
systemctl status apache2Ganglia server is now up and running. It's time to install and configure Ganglia client on the client system that you want to monitor.
You can install Ganglia client package by just running the following command:
apt-get install ganglia-monitor -yAfter installing Ganglia client, you will need to edit gmond.conf file.
nano /etc/ganglia/gmond.confMake the following changes:
udp_send_channel {
 host = 192.168.0.106
  port = 8649
  ttl = 1
}
Save and close the file, then start ganglia-monitor service with the following command:
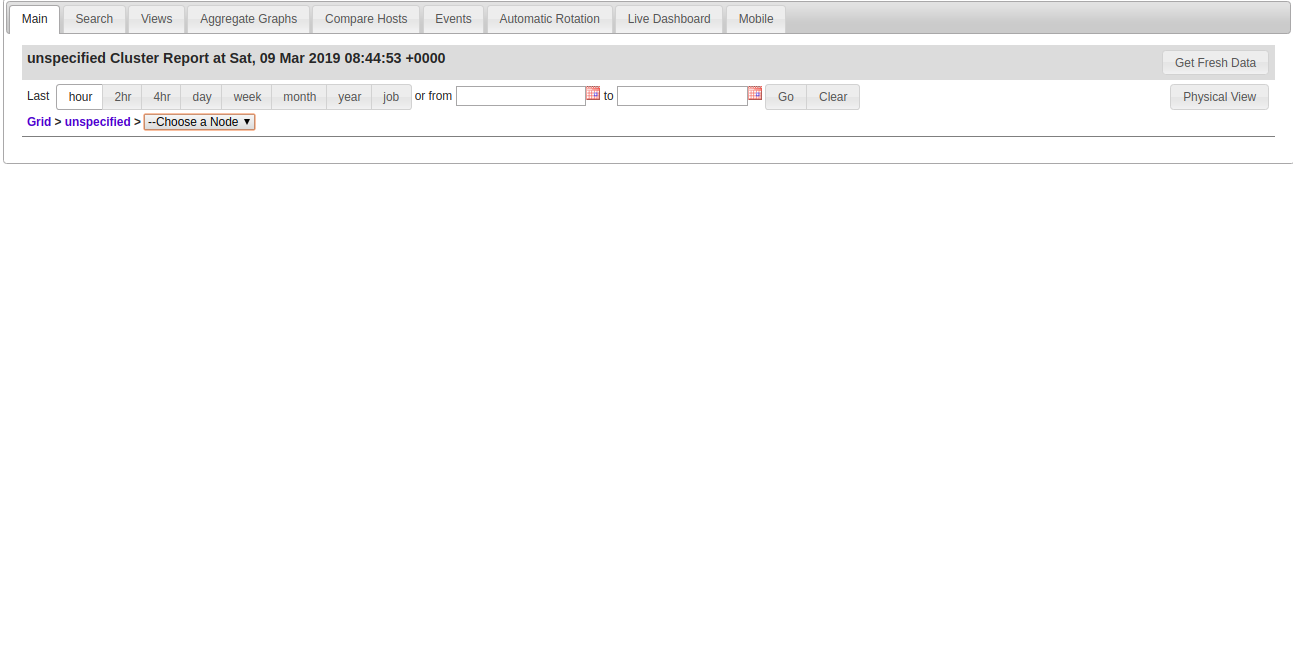
systemctl start ganglia-monitorOpen your web browser and type the URL http://192.168.0.106/ganglia . You will be redirected to the following page:

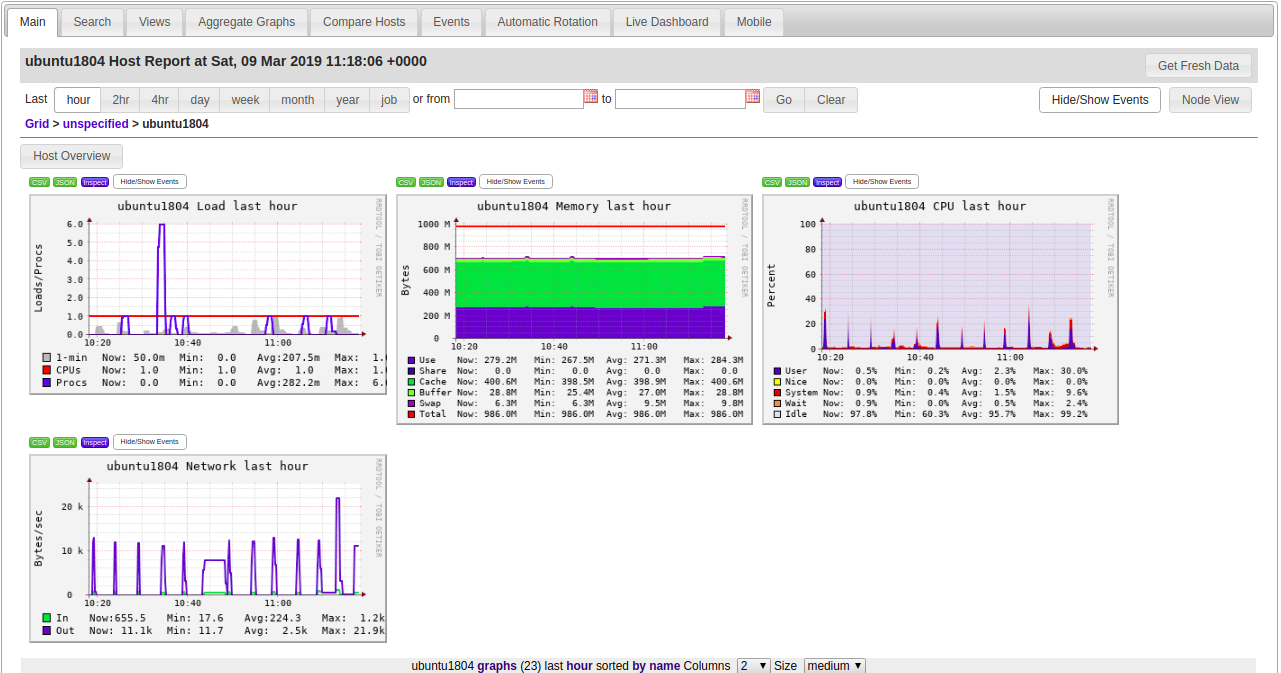
Now, click on Choose a Node and select ubuntu18.04. You should see all the details of ubuntu-18.04 server node in the following page:

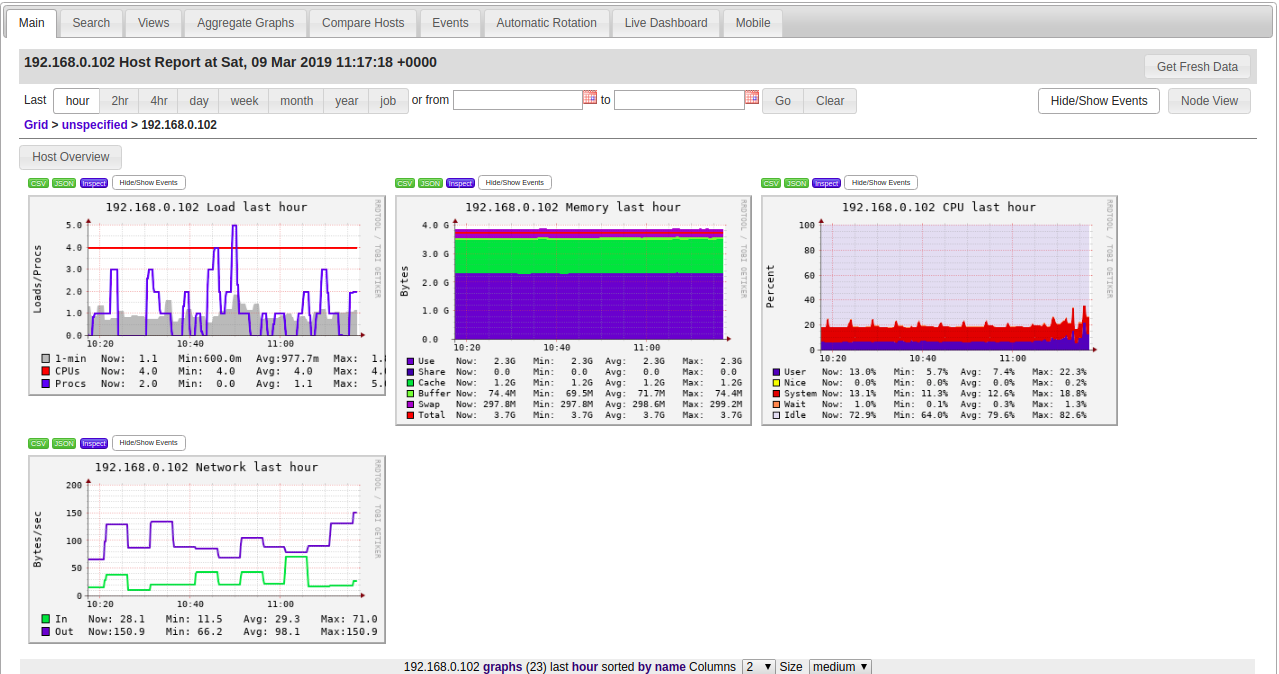
Next, click on Choose a Node and select 192.168.0.102 . You should see all the details of Client system in the following page:

Congratulations! You have successfully installed the Ganglia monitoring server on Ubuntu 18.04 server. You can now easily setup Ganglia in your environment as per your need.

39 posts | 6 followers
FollowAlibaba Clouder - January 26, 2021
Hiteshjethva - December 12, 2019
Hiteshjethva - March 2, 2020
Alibaba Clouder - September 28, 2018
Hiteshjethva - March 2, 2020
Hiteshjethva - May 29, 2021

39 posts | 6 followers
Follow Managed Service for Prometheus
Multi-source metrics are aggregated to monitor the status of your business and services in real time.
Learn More Application Real-Time Monitoring Service
Build business monitoring capabilities with real time response based on frontend monitoring, application monitoring, and custom business monitoring capabilities
Learn More Resource Management
Organize and manage your resources in a hierarchical manner by using resource directories, folders, accounts, and resource groups.
Learn More Super App Solution for Telcos
Alibaba Cloud (in partnership with Whale Cloud) helps telcos build an all-in-one telecommunication and digital lifestyle platform based on DingTalk.
Learn MoreMore Posts by Hiteshjethva