By Yanxun
How can we use the topology of Kubernetes Monitoring to explore the application architecture? How can we use the monitoring data collected by products to configure alerts to discover service performance issues? This article discusses the problem of resource usage and uneven traffic distribution when using Kubernetes Monitoring.
With the continuous practice of Kubernetes, we encounter more problems, such as SLB, cluster scheduling, and horizontal scaling. In the final analysis, the uneven distribution of traffic is exposed behind these problems. How can we find the use of resources and solve the problem of uneven traffic distribution? Today, we will discuss this problem and the corresponding solutions under three specific scenarios.
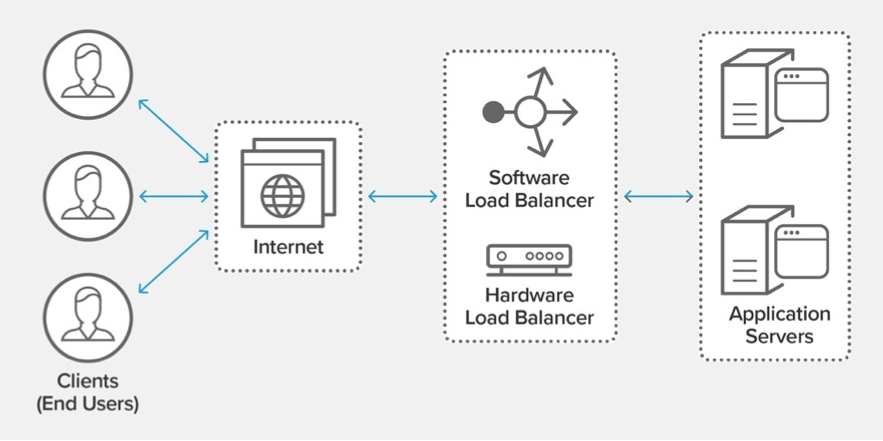
Generally speaking, the architecture has many layers for a business system. Each layer contains many components, such as service access, middleware, and storage. We hope the load of each component is balanced to make performance and stability the highest. However, it is difficult to find the following problems quickly in the multi-language multi-communication protocol scenario. For example:
The load of typical scenarios in practice is unbalanced. The online traffic forwarding strategy or the traffic forwarding component has problems, which leads to the imbalance of the number of requests received by each instance of the application service. The traffic processed by some instances is significantly higher than other nodes. As a result, the performance of these instances significantly deteriorated compared with other instances. The requests routed to these instances cannot be responded to in time. The overall performance and stability of the system are reduced.

Cloud users mostly use cloud service instances (except for uneven server scenarios). In practice, the traffic processed by each instance of application services is even. However, the traffic of nodes accessing cloud service instances is uneven, resulting in the overall performance and stability of cloud service instances. This scenario usually happens when the application runs, the overall link combing, and the upstream and downstream analysis of specific problem nodes.
How can we find and solve problems quickly? We can find out the problems on the client and server from the service load and request load and determine whether the service load and external request load of each component instance are balanced.
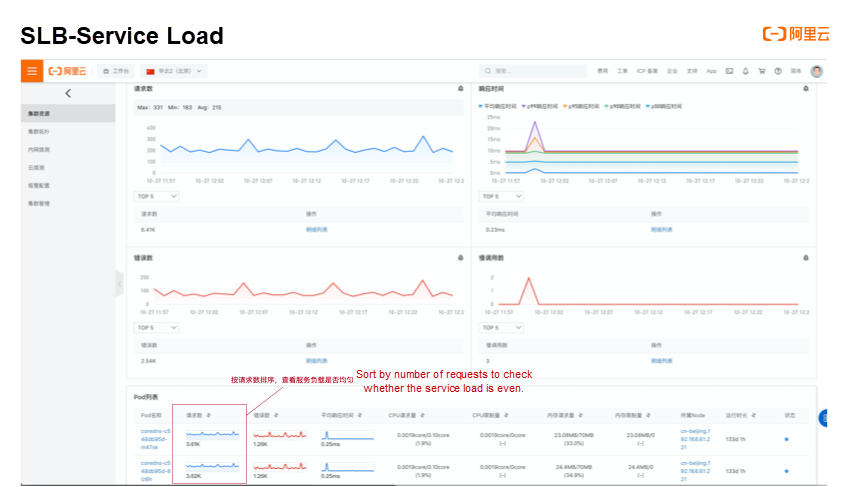
For server load balancing troubleshooting, we need to know the service details and perform more targeted troubleshooting for any specific Service, Deployment, DaemonSet, and StatefulSet. The pod list section lists all pods at the backend using the Kubernetes Monitoring service details feature. In the table, we list the aggregate value and the time series of the number of requests for each pod in the selected period. We can clearly see whether the traffic of the backend is even by sorting the number of requests in the column.
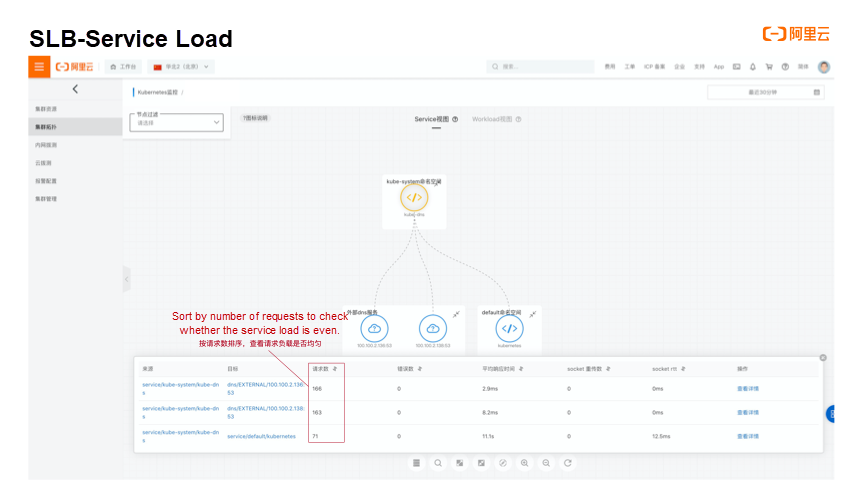
Kubernetes Monitoring provides the cluster topology function for client SLB troubleshooting. We can view its associated topology for any specific Service, Deployment, DaemonSet, and StatefulSet. After selecting the association relationship, click Tabulation, and then all the network topologies associated with the problem entity will be listed. Each item of the table is the topological relationship requested by the application service node. The table shows the topological relationships of the external pull of the app service node. We list the aggregate value and the time series of the number of requests for each topological relationship in the selected period. You can clearly see whether the traffic to a specific server accessed by a specific node as a client is even by sorting the number of requests in one column.
In the Kubernetes cluster deployment scenario, the process of distributing pods to a certain node is called scheduling. For each pod, the scheduling process includes two steps: finding candidate nodes according to filtering conditions and finding the best node. In addition to filtering nodes according to the taint of pod and node, the scheduling process includes finding candidate nodes according to filtering conditions and enduring the relationship. It is also very important to filter according to the amount of resource reservation. For example, if the CPU of a node only has 1 core reservation, the node will be filtered for a pod requesting 2 cores. Finding the best node is completed according to the affinity between pod and node. The idle node is generally selected among the filtered nodes.
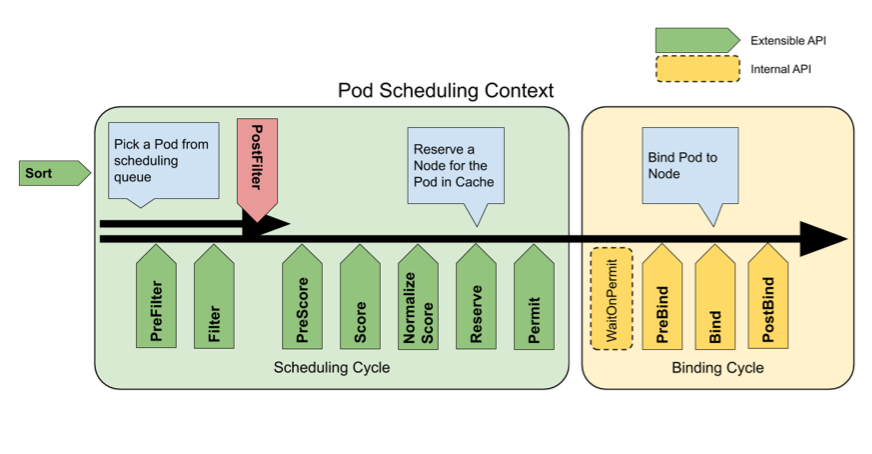
Based on the theory above, we often encounter some problems in the process of practice.
A typical scenario in an actual work practice is resource hot issues. Pod scheduling problems frequently occur on specific nodes. The resource utilization of the entire cluster is extremely low, but pods cannot be scheduled. As shown in the figure, Node1 and Node2 are full of pods, and Node3 does not have any pods scheduled. This problem affects the high availability of cross-region disaster recovery and the overall performance. We usually enter this scenario when the pod schedule fails.
How do we deal with it?
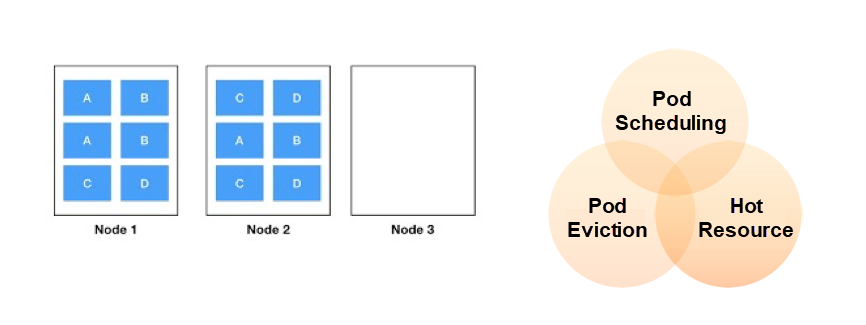
We should usually focus on the following three main points when troubleshooting pods that cannot be scheduled.
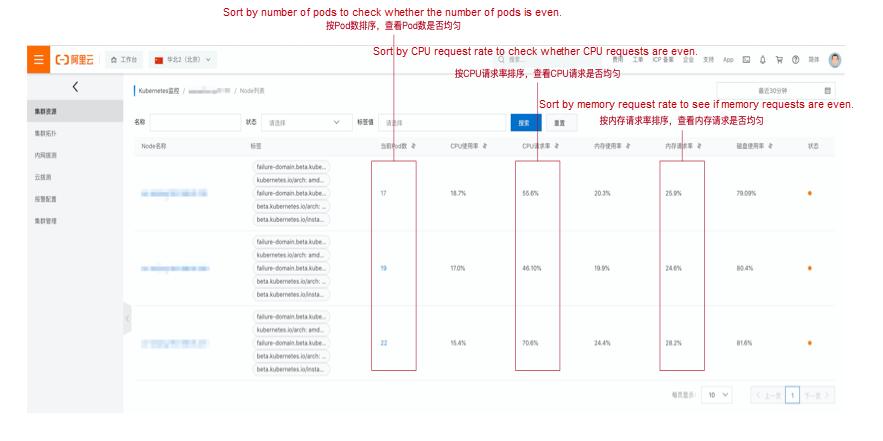
The cluster node list provided by Kubernetes Monitoring shows the three main points above. Check whether each node is even by sorting to view resource hot issues. For example, if the CPU request rate of a node is close to 100%, it means any pod with CPU requests cannot be scheduled to the node. If only the CPU request rate of individual nodes is close to 100% and other nodes are idle, it is necessary to check the resource capacity and pod distribution of the node to troubleshoot the problem further.
In addition to resource hotspot issues for nodes, containers have the same issue. As shown in the figure, for a multi-replica service, the resource usage distribution of its containers may also have resource hot issues, which are mainly reflected in the CPU and memory usage. The CPU is a compressible resource in the container environment. After the upper limit is reached, it will only be limited and will not affect the lifecycle of the container. However, if the container environment is an incompressible resource, OOM will occur after the upper limit is reached. Although the number of requests processed by each node is the same when running, the CPU and memory consumption may be different due to different parameters of different requests. This will cause hot spots for some container resources, which will affect the lifecycle and automatic scaling.
In view of the hot issues of container resources, we need to pay attention to the following points through theoretical analysis:
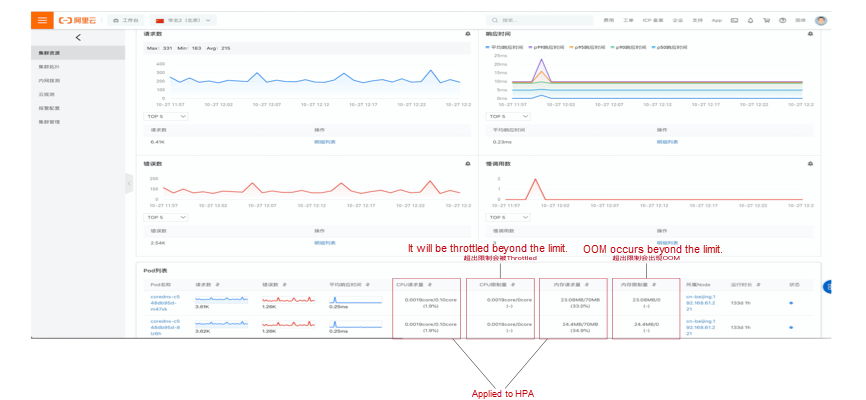
Kubernetes Monitoring displays the four key points above in the pod list of service details. It supports sorting and checks whether each pod is even to view resource hot issues. For example, if the CPU usage/request rate of a pod is close to 100%, it means that automatic scaling may be triggered. If only the CPU usage/request rate of the individual pod is close to 100% and other nodes are idle, you need to check the processing logic to troubleshoot the problem further.
The essence of a single point problem is a high availability problem. There is only one solution to the high availability problem: redundancy, which includes multiple nodes, multiple regions, multiple zones, and multiple data centers; the more decentralized and redundant, the better. In addition, in the case of increasing flow and increasing component pressure, whether the components of the system can be expanded horizontally has also become an important issue.

The application service only has one node at most for a single point problem. The system crashes when the node cannot be solved by restart due to network or other problems. When the traffic growth exceeds the processing capacity of one node, the overall performance of the system will deteriorate seriously because there is only one node. The single point problem will affect the performance and high availability of the system. Kubernetes Monitoring supports viewing the number of replicas of the Service, Daemon set, StatefulSet, and Deployment to locate a single point of the problem quickly.
The introduction above shows that Kubernetes Monitoring can troubleshoot SLB problems in multi-language and multi-communication protocol scenarios from multiple perspectives on the server and client. At the same time, it can troubleshoot resource hot issues of containers, nodes, and services. Finally, it supports single point problem troubleshooting through replica number check and traffic analysis. These checkpoints will be used as scene switches in the subsequent iteration process. They can automatically check and alarm after one key is turned on.
Anomaly Detection in Real-World Scenarios + Assistance from Prometheus
The Evolution History of Observable Data Standards from Opentracing and OpenCensus to OpenTelemetry

675 posts | 56 followers
FollowAlibaba EMR - May 11, 2021
Alibaba Developer - January 28, 2021
Alibaba Developer - February 7, 2022
Alibaba Clouder - February 24, 2021
Aliware - August 18, 2021
Alibaba Developer - September 23, 2020

675 posts | 56 followers
Follow Server Load Balancer
Respond to sudden traffic spikes and minimize response time with Server Load Balancer
Learn More Container Service for Kubernetes
Alibaba Cloud Container Service for Kubernetes is a fully managed cloud container management service that supports native Kubernetes and integrates with other Alibaba Cloud products.
Learn More Architecture and Structure Design
Customized infrastructure to ensure high availability, scalability and high-performance
Learn More Apsara Stack
Apsara Stack is a full-stack cloud solution created by Alibaba Cloud for medium- and large-size enterprise-class customers.
Learn MoreMore Posts by Alibaba Cloud Native Community