Released by ELK Geek
Elasticsearch is increasingly used as an enterprise business solution due to its simplicity and excellent performance in big data processing. However, any new solution must undergo a series of investigations and tests before it is adopted. In this spirit, this article introduces esrally, an official stress testing tool for Elasticsearch.
First, let's look at a definition of stress testing on Baidu's Encyclopedia.
Stress testing is a test method used to establish system stability. It usually forces a system to go beyond its normal operating conditions so as to identify its functional limits and hidden risks.
According to this definition, the purpose of stress testing is to measure the limits of a system and discover hidden risks in advance so that you can design precautions. In my opinion, stress testing for Elasticsearch generally serves the following purposes:
Now that you know the purpose of stress testing, you may wonder how you should go about it. Generally, you can take one of the following approaches:
Each stress testing solution has its own advantages and disadvantages. You should select the most appropriate approach based on your needs and familiarity with the tools. Next, we will give a detailed description of esrally.
Elasticsearch Rally, also known as esrally, is a Python 3-based open-source Elasticsearch stress testing tool provided by Elasticsearch. You can find the source code at https://github.com/elastic/rally
For more information, see this blog. esrally provides the following features:
Elasticsearch also officially uses esrally to test its performance and publishes the results on https://elasticsearch-benchmarks.elastic.co/ in real time. This website provides performance data for Elasticsearch. The official Elasticsearch team uses one sever each to run esrally and Elasticsearch during stress testing.
The configurations of the servers are as follows:
CPU: Intel(R) Core(TM) i7-6700 CPU @ 3.40GHz
RAM: 32 GBSSD: Crucial MX200
OS: Linux Kernel version 4.8.0-53
JVM: Oracle JDK 1.8.0_131-b11
The options, such as Geonames, Geopoint, and Percolator, in the top navigation bar of the website represent stress tests for different data sets. For example, the following figures show the stress testing results of logging log data.
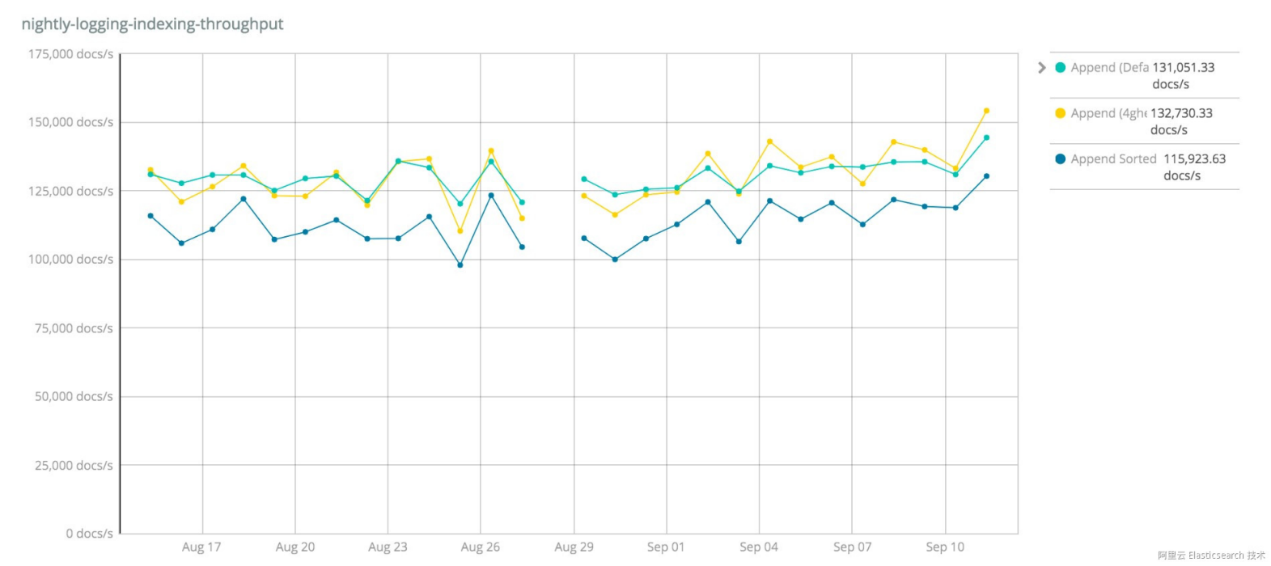
Write performance
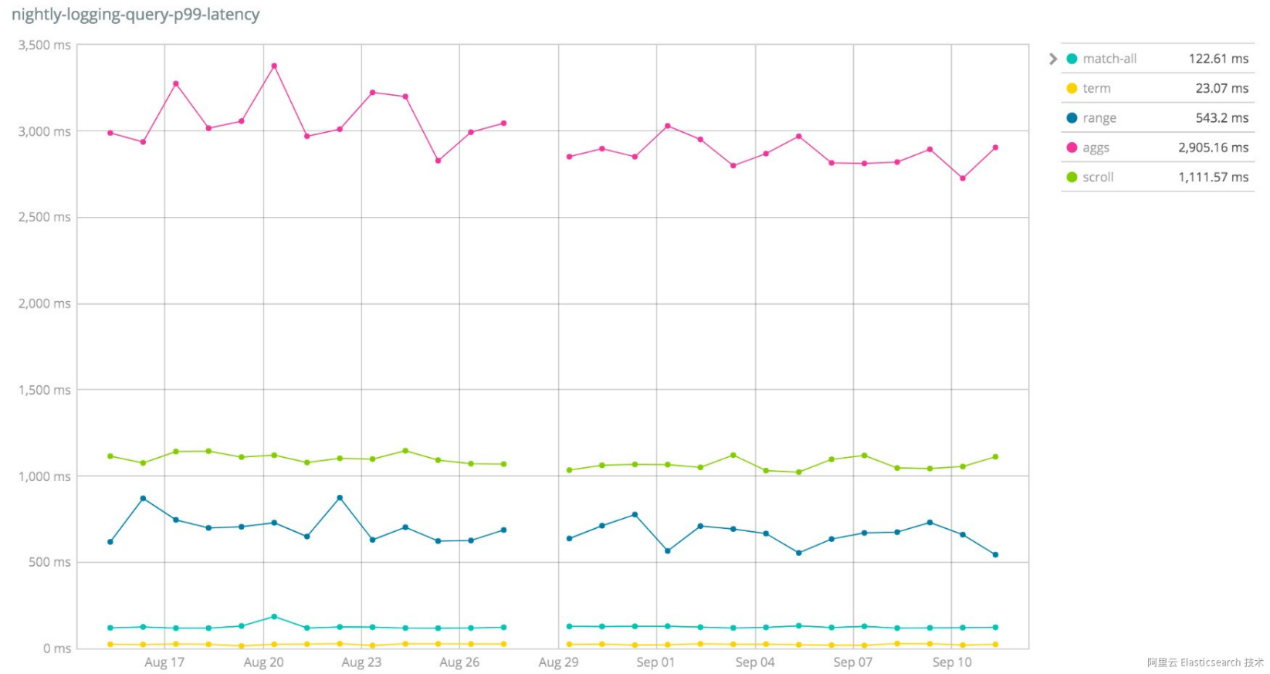
Read performance
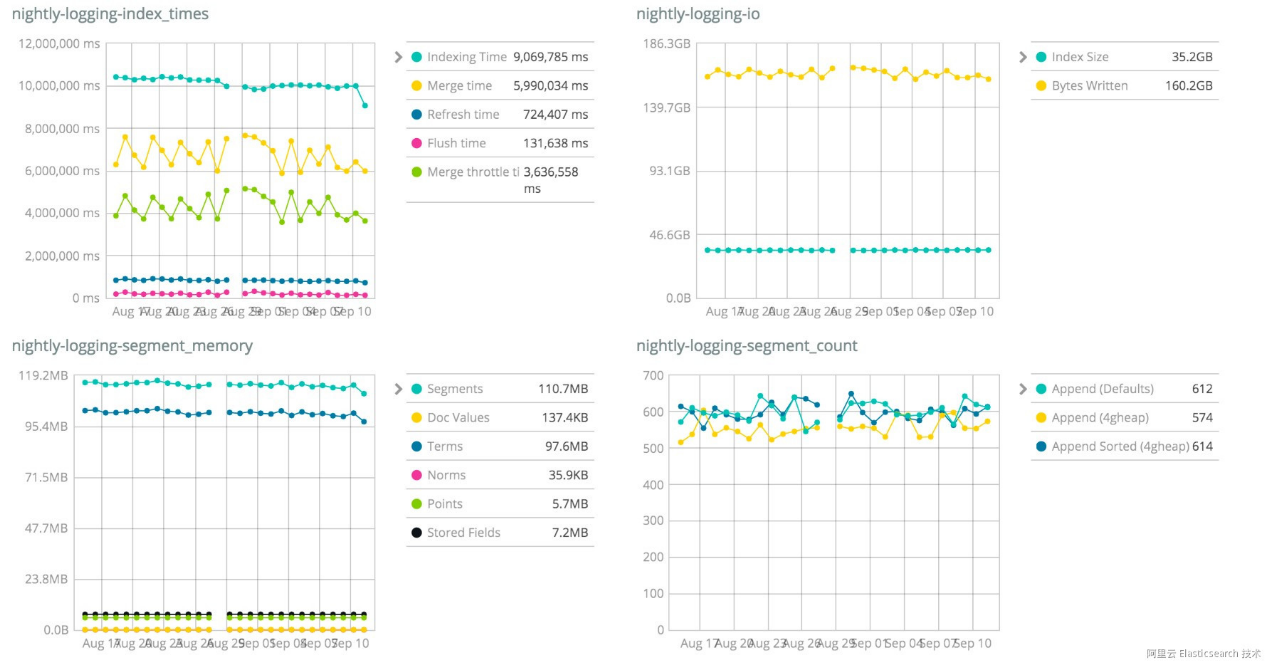
Other system metrics
You can find the esrally documentation here. This article briefly describes how to install and run esrally.
Install the following software for esrally:
Run the following command to install esrally:
pip3 install esrallyTips:
You can use pip sources in China, such as those from Douban or Alibaba, to facilitate the installation.
After the installation, run the following configuration command to confirm data storage paths:
esrally configureNow you are ready to run your first test. For example, run the following command to perform a stress test for Elasticsearch 5.0.0.
esrally --distribution-version=5.0.0After the test, you will get a result like the one below.
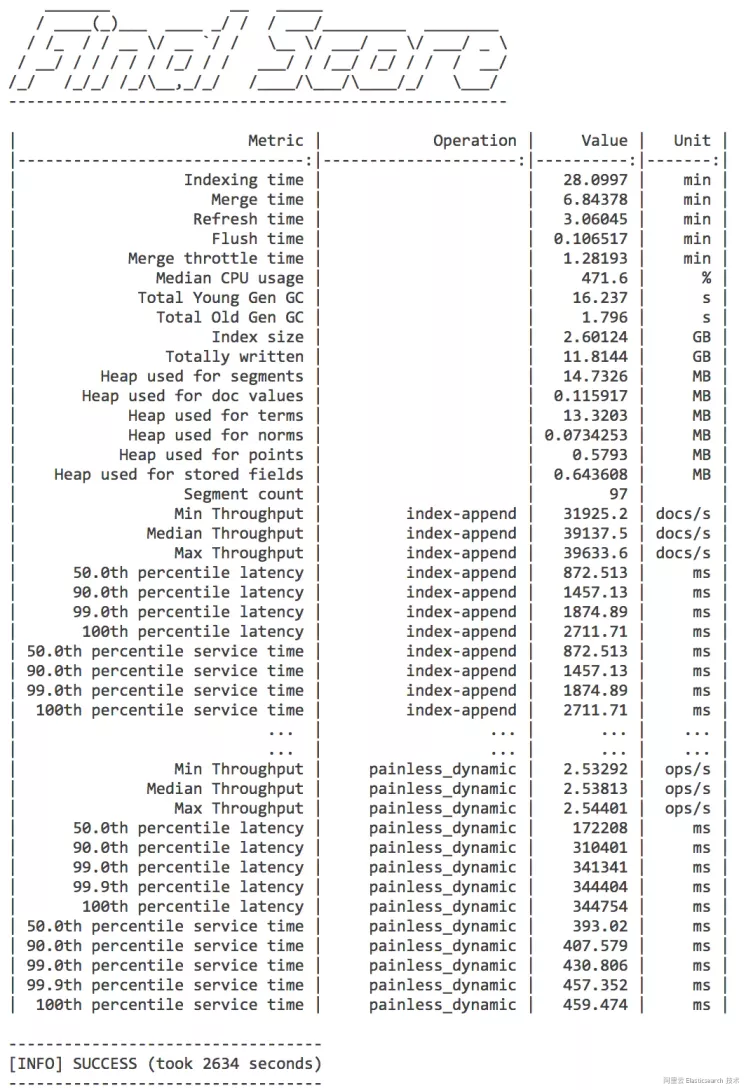
Stress testing result
The data may seem confusing to you. Let's explain it step by step.
Tips:
esrally test data is stored on AWS servers outside China. Therefore, downloading esrally test data can be very slow or even fail due to timeout, making stress testing difficult. To address this issue, the test data is compressed and uploaded to a server in China so that you can download it and put it in your esrally data folder to ensure normal stress testing. In addition, due to the large data volume, a stress test usually takes about one hour. Therefore, you need to be patient.
To quickly try out esrally, add the --test-mode parameter so that only 1,000 files are downloaded for your test.
A rally is a term used for a car race. In esrally, stress tests are compared to auto rallies, so the tool borrows many terms from auto racing.
A track means a racing track. In esrally, tracks refer to data and test policies used in stress testing. For more information, go here. All the built-in tracks for esrally are available on GitHub at https://github.com/elastic/rally-tracks
The repository contains a lot of test data, such as the geonames, geopoint, logging, and nested folders. Each folder contains a README.md file to provide details about the data and a track.json file to define stress testing policies.
Let's take a look at the loggins/track.json file.
{% import "rally.helpers" as rally with context %}

{
  "short-description": "Logging benchmark",
  "description": "This benchmark indexes HTTP server log data from the 1998 world cup.",
  "data-url": "https://benchmarks.elasticsearch.org.s3.amazonaws.com/corpora/logging",
  "indices": [
    {
      "name": "logs-181998",
      "types": [
        {
          "name": "type",
          "mapping": "mappings.json",
          "documents": "documents-181998.json.bz2",
          "document-count": 2708746,
          "compressed-bytes": 13815456,
          "uncompressed-bytes": 363512754
        }
      ]
    },
    {
      "name": "logs-191998",
      "types": [
        {
          "name": "type",
          "mapping": "mappings.json",
          "documents": "documents-191998.json.bz2",
          "document-count": 9697882,
          "compressed-bytes": 49439633,
          "uncompressed-bytes": 1301732149
        }
      ]
    }
  ],
  "operations": [
    {{ rally.collect(parts="operations/*.json") }}
  ],
  "challenges": [
    {{ rally.collect(parts="challenges/*.json") }}
  ]
}
The .json file consists of the following sections:
Here is a definition in operations/default.json:
{
      "name": "index-append",
      "operation-type": "index",
      "bulk-size": 5000
}
The operation-type values include index, force-merge, index-stats, node-stats, and search. Each value has its own custom parameters. For example, you can specify the bulk-size parameter to determine the number of documents to be written in bulk into the index.
Here is a definition in challenges/default.json:
{
      "name": "append-no-conflicts",
      "description": "",
      "default": true,
      "index-settings": {
        "index.number_of_replicas": 0
      },
      "schedule": [
        {
          "operation": "index-append",
          "warmup-time-period": 240,
          "clients": 8
        },
        {
          "operation": "force-merge",
          "clients": 1
        },
        {
          "operation": "index-stats",
          "clients": 1,
          "warmup-iterations": 100,
          "iterations": 100,
          "target-throughput": 50
        },
        {
          "operation": "node-stats",
          "clients": 1,
          "warmup-iterations": 100,
          "iterations": 100,
          "target-throughput": 50
        },
        {
          "operation": "default",
          "clients": 1,
          "warmup-iterations": 100,
          "iterations": 500,
          "target-throughput": 10
        },
        {
          "operation": "term",
          "clients": 1,
          "warmup-iterations": 100,
          "iterations": 500,
          "target-throughput": 60
        },
        {
          "operation": "range",
          "clients": 1,
          "warmup-iterations": 100,
          "iterations": 200,
          "target-throughput": 2
        },
        {
          "operation": "hourly_agg",
          "clients": 1,
          "warmup-iterations": 100,
          "iterations": 100,
          "target-throughput": 0.2
        },
        {
          "operation": "scroll",
          "clients": 1,
          "warmup-iterations": 100,
          "iterations": 200,
          "target-throughput": 10
        }
      ]
}
In this case, a challenge named append-no-conflicts is defined. Each stress test runs only one challenge. Therefore, the default parameter here indicates the challenge that is run by default when no challenge is specified for the stress test. The schedule element contains the following nine tasks to be executed in sequence for this challenge: index-append, force-merge, index-stats, node-stats, default, term, range, hourly_agg, and scroll. In this example, each task contains an operation. You can specify additional properties such as clients (the number of clients that execute a task concurrently), warmup-iterations (the number of iterations that each client executes for warmup), and iterations (the number of operation iterations that each client executes). For more information, go here.
You can run the following command to view tracks currently available for your esrally.
esrally list tracksesrally track repositories are located in the benchmarks/tracks/ file in the rally directory (or in the ~/.rally directory by default for the Mac operating system).
A car refers to a race car. In esrally, cars refer to Elasticsearch instances of different configurations. You can run the following command to view cars currently available for your esrally:
esrally list cars
Name
----------
16gheap
1gheap
2gheap
4gheap
8gheap
defaults
ea
verbose_iw
Configurations of cars are located in the benchmarks/teams/default/cars/ rally directory (or in the ~/.rally directory by default for the Mac operating system). For more information, see the car documentation. You can modify all Elasticsearch configurations except for heap configurations.
A race is a competition. In esrally, it refers to a stress test. For a race, tracks and cars must be available. If no car is specified, the default configuration is used. If no track is specified, the geonames track is used by default. Run the following command to execute a race:
esrally race --track=logging --challenge=append-no-conflicts --car="4gheap"According to the preceding command, the stress test uses the track named logging, runs the challenge named append-no-conflicts in the track, and specifies a 4gheap Elasticsearch instance as the car 4gheap. For more information, see the race documentation.
In esrally, a tournament consists of multiple races. Run the following command to view all races:
esrally list races
Recent races:
Race Timestamp    Track    Challenge            Car       User Tag
----------------  -------  -------------------  --------  ------------------------------
20160518T122341Z  pmc      append-no-conflicts  defaults  intention:reduce_alloc_1234
20160518T112057Z  pmc      append-no-conflicts  defaults  intention:baseline_github_1234
20160518T101957Z  pmc      append-no-conflicts  defaults
You can run the following command to compare data between different races:
esrally compare --baseline=20160518T112057Z --contender=20160518T112341Z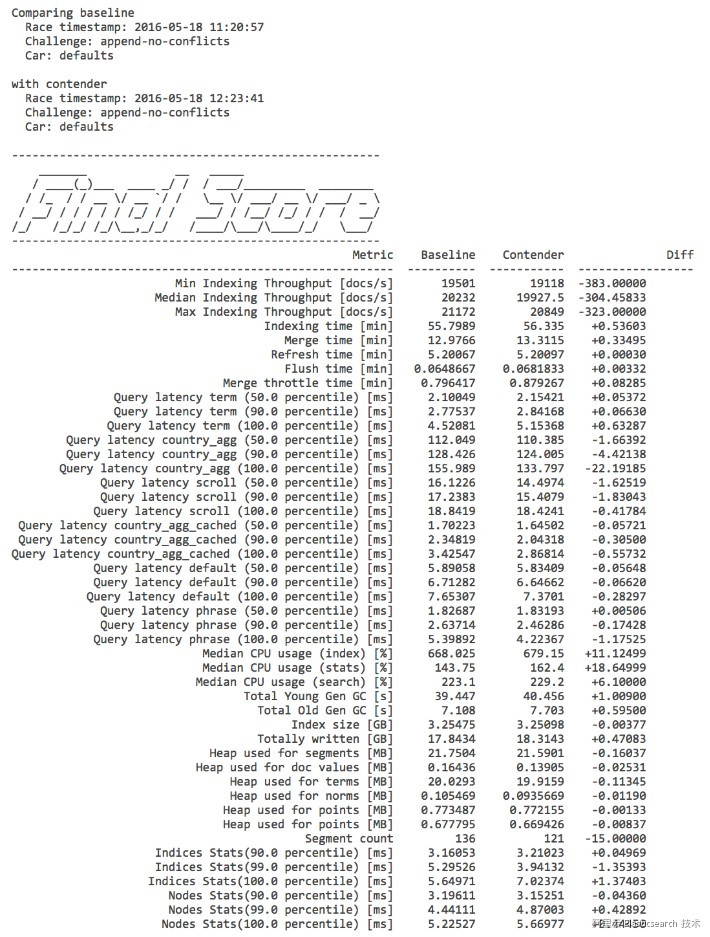
Data comparison of two races
For more information, see the tournament documentation.
In esrally, a pipeline is a stress testing process. You can run the following command to view existing pipelines:
esrally list pipeline
Name                     Description
-----------------------  ---------------------------------------------------------------------------------------------
from-sources-complete    Builds and provisions Elasticsearch, runs a benchmark and reports results.
from-sources-skip-build  Provisions Elasticsearch (skips the build), runs a benchmark and reports results.
from-distribution        Downloads an Elasticsearch distribution, provisions it, runs a benchmark and reports results.
benchmark-only Assumes an already running Elasticsearch instance, runs a benchmark and reports resultsFor more information, see the pipeline documentation.
An esrally stress test consists of the following three steps:
When a stress test is completed, esrally outputs the result to the terminal and outputs the result files in the esrally/logs and esrally/benchmarks/races directories, as shown in the following figure.
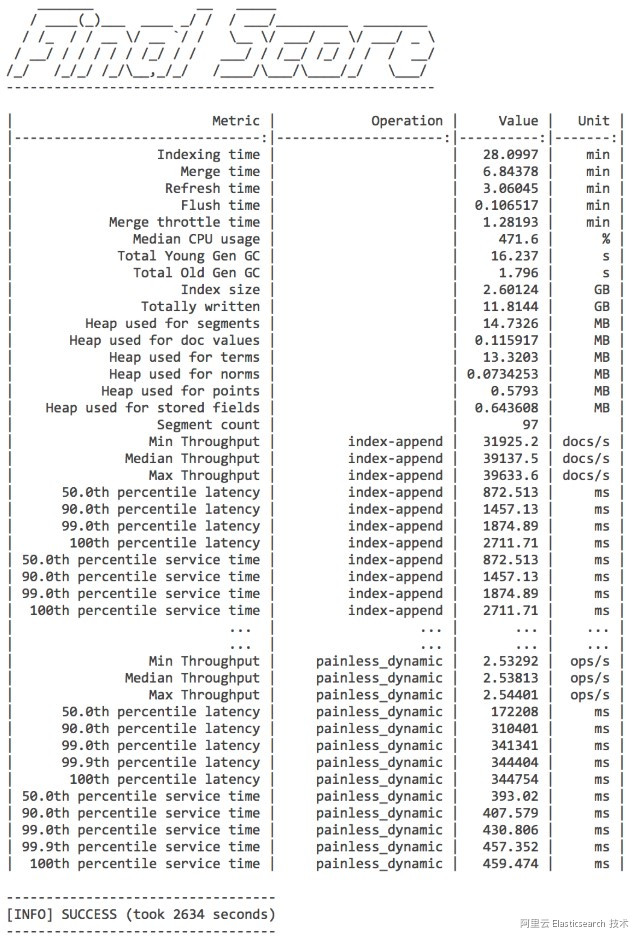
Stress test result
A lot of metric data is listed in the Metric column. For more information, see the relevant documentation. You need to check the following metrics:
You can use the metrics that are most appropriate for your situation.
Each stress test is named after its time. For example, the name logs/rally_out_20170822T082858Z.log indicates that the stress test was started at 08:28:58 on August 22, 2017, and the final result and Elasticsearch operation logs of this stress test are recorded in benchmarks/races/2017-08-22-08-28-58.
In addition, for tests in the benchmark-only pipeline, namely, stress tests on existing clusters, you can install the X-Pack Basic version for monitoring. This allows you to view the relevant metrics during the stress tests.
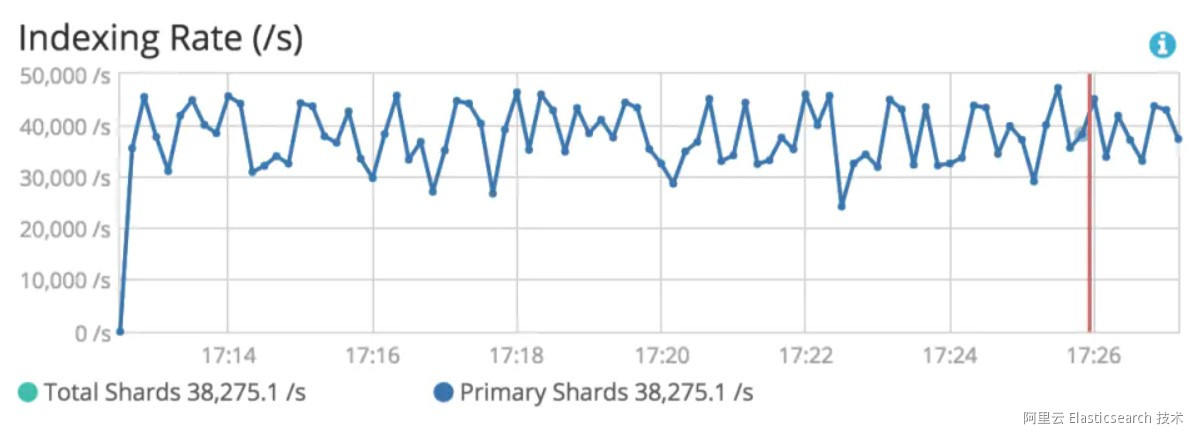
X-Pack monitoring
esrally can be configured to save all race result data to a specified Elasticsearch instance. The configuration is as follows, which is stored in the rally.ini file in the esrally directory:
 [reporting]
datastore.type = elasticsearch
datastore.host = localhost
datastore.port = 9200
datastore.secure = False
datastore.user =
datastore.password =
esrally stores data in the following three indexes. The asterisk (*) indicates the month. This means result data is stored by month.
1. The rally-metrics-* index records the result of each race by metric. The following figure shows all metrics of a race.

Metric data
The Time column lists the time of a stress test. The @timestamp column lists the time when metrics are collected. The Operation column lists specific operations performed. Any metric without an operation corresponds to an aggregation value. For example, the indexing_total_time metric indicates the total indexing time, and the segments_count metric indicates the total number of segments. Any metric with an operation records data of the operation. Note that the data of an operation is recorded according to the sampling time, not as final aggregated data. As shown in the preceding figure, one hour_agg operation has multiple metrics named service_time but collected at different times. Based on the data, you can make a visual chart of a particular metric in a race. For example, you can observe the throughput metric of the index-log task in this race by using the method shown in the following figure.
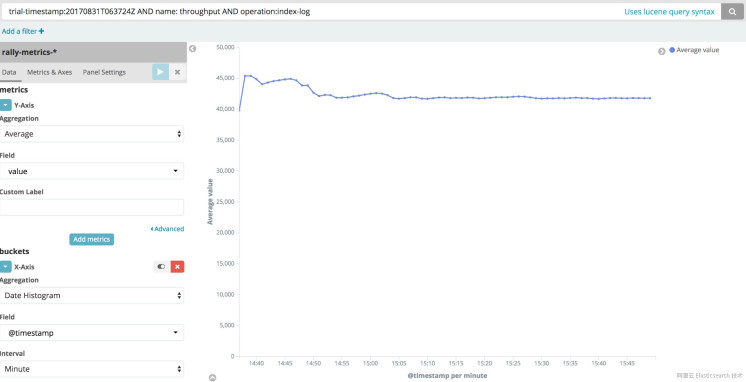
Metric data display
2. The rally-result-* index records the final aggregated result of each race by metric, such as the following data:
{
   "user-tag": "shardSizeTest:size6",
   "distribution-major-version": 5,
   "environment": "local",
   "car": "external",
   "plugins": [
     "x-pack"
   ],
   "track": "logging",
   "active": true,
   "distribution-version": "5.5.2",
   "node-count": 1,
   "value": {
     "50_0": 19.147876358032228,
     "90_0": 21.03116340637207,
     "99_0": 41.644479789733886,
     "100_0": 47.20634460449219
   },
   "operation": "term",
   "challenge": "default-index",
   "trial-timestamp": "20170831T063724Z",
   "name": "latency"
 }
In this example, the latency metric of the term operation is recorded as an aggregated value in the form of a percentile. The data allows you to draw a multi-race comparison chart based on a particular metric. The following figure shows the comparison of multiple races based on the latency of hourly_agg (hour-based aggregation), default (match_all), term, and range queries.
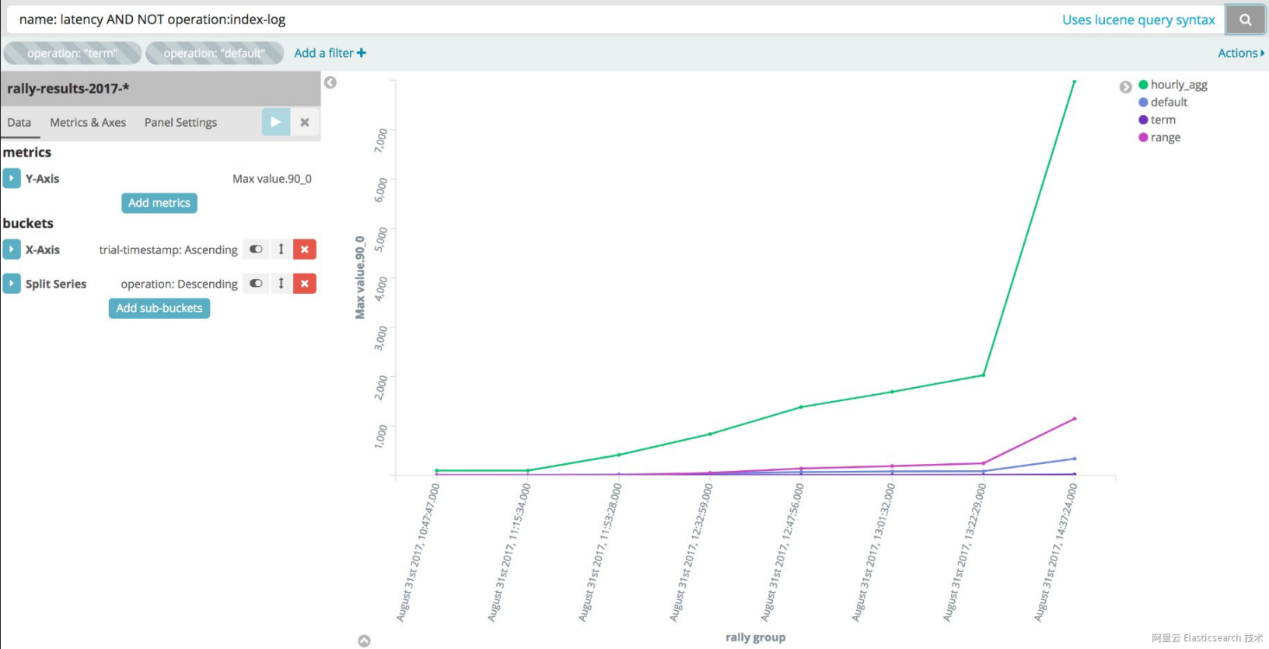
Latency-based comparison of multiple races
3. The rally-races-* index records the final results of all races, namely, the output of command line execution.
In addition to Elasticsearch-related metric data, esrally records some test environment information, such as the operating system and JVM, allowing you to view the software and hardware environments involved in the test.
The following practice problems are presented in a Q&A manner. Try to solve the questions on your own before you refer to the answers.
How can you identify the performance improvement of Elasticsearch 5.5.0 compared with Elasticsearch 2.4.6?
Perform stress testing on Elasticsearch 5.5.0 and Elasticsearch 2.4.6 respectively, and then compare the relevant metrics of the two versions. Use the following track and challenge:
1. Test the performance of Elasticsearch 2.4.6.
esrally race --distribution-version=2.4.6 --track=nyc_taxis --challenge=append-no-conflicts --user-tag="version:2.4.6"2. Test the performance of Elasticsearch 5.5.0.
esrally race --distribution-version=5.5.0 --track=nyc_taxis --challenge=append-no-conflicts --user-tag="version:5.5.0"3. Compare the results of the two races.
esrally list races
esrally compare --baseline=[2.4.6 race] --contender=[5.5.0 race]
Tips:
Use the --user-tag parameter to create tags for the race to facilitate subsequent searches.
To perform a quick test, add the --test-mode parameter to rapidly run a race by using test data.
How can you test the impact of disabling the _all feature on the write performance?
Perform two tests on Elasticsearch 5.5.0, one with the _all feature enabled and the other with the feature disabled. Then, compare the results of the two tests. Only perform index operations as you only need to test the write performance. Use the following track and challenge:
1. By default, the _all feature is disabled in the mapping settings of the nyc_taxis track. Test the performance when the _all feature is disabled.
esrally race --distribution-version=5.5.0 --track=nyc_taxis --challenge=append-no-conflicts --user-tag="enableAll:false" --include-tasks="type:index"2. Modify the mapping settings of the nyc_taxis track to enable the _all feature. The mapping file is located in the rally home directory.
In the benchmarks/tracks/default/nyc_taxis/mappings.json file, change the _all.enabled value to true.
esrally race --distribution-version=5.5.0 --track=nyc_taxis --challenge=append-no-conflicts --user-tag="enableAll:true" --include-tasks="type:index"3. Compare the results of the two races.
esrally list races
esrally compare --baseline=[enableAll race] --contender=[disableAll race]
The following figure shows the comparison result of the two races when the --test-mode parameter is used. As you can see, disabling the _all feature improves the write performance.
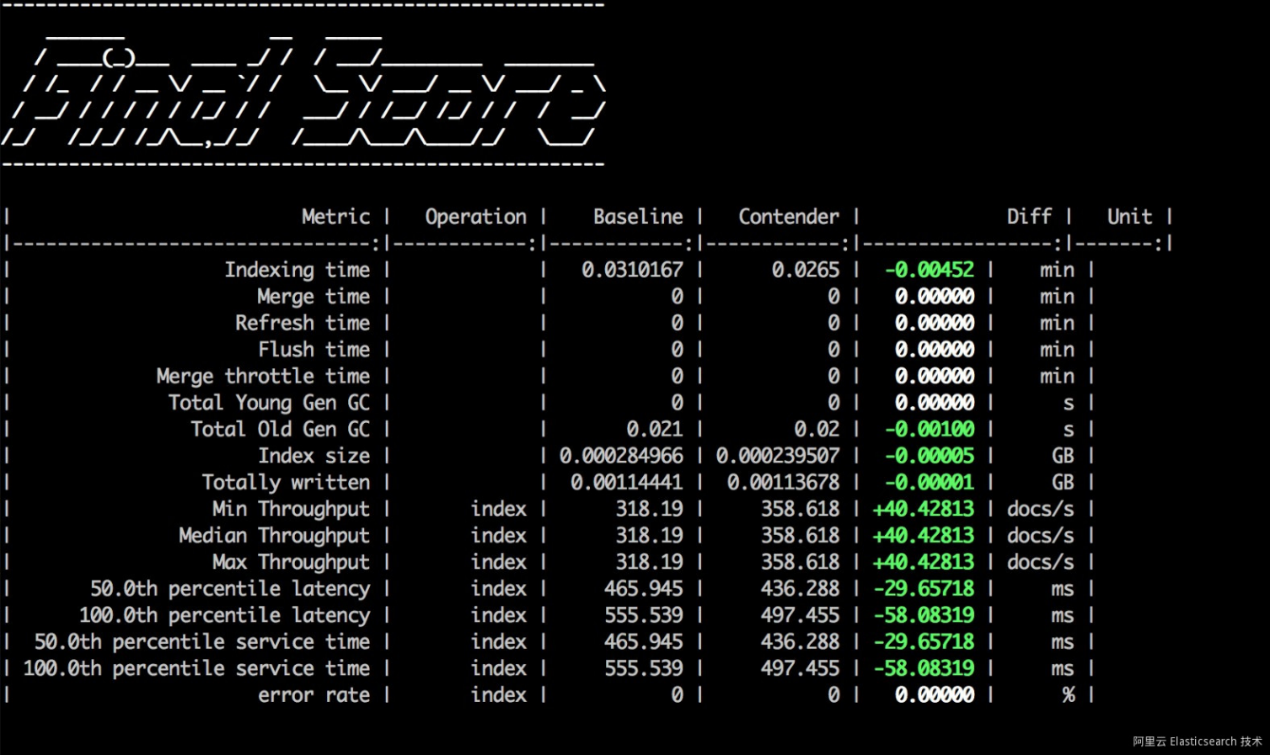
Test result
Tips:
You can use the --include-tasks parameter to run only certain tasks in the challenge.
How do you test the performance of an existing cluster?
Use the benchmark-only pipeline. Use the following track and challenge:
1. Run the following command to test an existing cluster:
esrally race --pipeline=benchmark-only --target-hosts=127.0.0.1:9200 --cluster-health=yellow --track=nyc_taxis --challenge=append-no-conflictsTips:
The --cluster-health=yellow parameter indicates that esrally checks the cluster status by default. If the cluster status is not green, esrally immediately closes. You add this parameter to address the situation.
I hope that the preceding three practice problems can help you quickly learn how to use esrally.
As mentioned above, esrally comes with some readily-available configurations. However, you can resort to the following two solutions if you have other needs.
1. Customize your own car.
You can create a car configuration file in the benchmarks/teams/default/cars esrally directory. For more information, see the car documentation.
2. Build your own cluster.
You can build a cluster independent of esrally as needed.
esrally comes with many tracks that include a lot of data, as shown in the following figure.
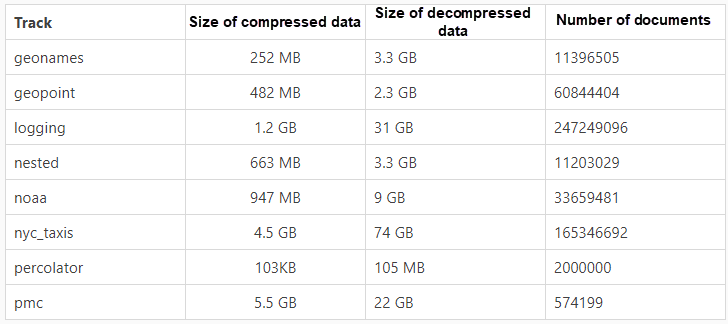
These data files are located in the benchmarks/data esrally directory. Tracks are designed for different testing purposes. For more information, see corresponding repositories in GitHub.
You can customize tracks for directional stress testing on your own data. The customization process is simple. For more information, see the relevant documentation. The procedure is as follows:
esrally list rack command to view the custom track.esrally also supports distributed stress testing. If a single instance cannot support the number of requests or request concurrency you need, you can run esrally on multiple instances. For more documentation for distributed stress testing, go here. In this case, the esrally daemon is used, and the corresponding command is esrallyd. In short, esrally combines multiple instances into a cluster by using the esrallyd command and then distributes test tasks to corresponding instances by setting the --load-driver-hosts parameter. For more information, see the relevant documentation mentioned above.
How do you determine the number of shards of an index?
In fact, this question gives rises to two more questions:
To answer the two questions, you need to understand what shards do. Shards are the foundation of Elasticsearch's distributed capabilities. When documents are indexed into Elasticsearch, Elasticsearch allocates each document to a corresponding shard according to a routing algorithm. Each shard corresponds to one lucene index. Is there an upper limit on the number of documents that can be stored in each shard? The answer is yes. Each shard can store up to 2^31 documents, that is, approximately 2 billion documents. This is a hard limit in the lucene design. Does this mean that one or a few shards are enough if you have less than 2 billion documents? Not exactly. A larger shard means slower queries and higher costs for data migration and recovery. Therefore, we recommend that you keep the size of each shard below 50 GB. For more information, see discussion 1 and discussion 2.
Here are the answers to the preceding two questions.
A small shard quantity is not necessarily good. If shards contain too much data, query performance is affected.
However, a large shard quantity is not necessarily good either. Query performance drops when there are too many shards because each Elasticsearch query is distributed to all shards and then the results are aggregated. Therefore, you should determine an appropriate number of shards based on your actual situation.
You can find an article on capacity planning from the Elasticsearch website here The following procedure is proposed in the article:
During the test, monitor relevant metrics such as index performance and query performance. If any performance metric breaks through your expected threshold, the corresponding shard size is the expected single shard size. Then, you can roughly determine the number of shards to be configured for an index by using the following formula:
Number of shards = Total data volume of the index/Maximum size of a single shardFor example, if the maximum size of a single shard is 20 GB, and you estimate that the maximum data volume of the index will not exceed 200 GB within one or two years, you can set the number of shards to 10.
Next, you need to use esrally to complete the preceding stress testing steps.
1. Manually maintain the creation and running of Elasticsearch nodes and use the benchmark-only pipeline to run esrally.
2. Customize your track, paying attention to the following two points:
{
  "name": "hourly_agg",
  "operation-type": "search",
  "index": "logs-*",
  "type": "type",
  "body": {
    "size": 0,
    "aggs": {
      "by_hour": {
        "date_histogram": {
          "field": "@timestamp",
          "interval": "hour"
        }
      }
    }
  }
}
The body element is a custom query statement. You can set query statements as needed.
3. Set the mapping of the index to be consistent with that of the online settings, such as whether the _all feature is enabled.
4. Perform stress tests based on your custom track. Run esrally and Elasticsearch on machines that are independent of each other, preventing interference with Elasticsearch performance.
Tips:
By default, esrally deletes existing indexes and then creates indexes during each stress test. To avoid this, you can set the auto-managed parameter to false in the configuration of each index. For more information, go here.
By using this parameter, you can perform stress tests on query performance separately, instead of importing data first.
esrally provides a complete configuration file-based testing process for Elasticsearch stress testing, which greatly simplifies operations and supports repeated verification. Users in China may find it very time-consuming to download the built-in track files for esrally from the AWS server, which is located outside China. Fortunately, you do not have to rely entirely on the built-in tracks because you can customize your own tracks.
esrally is great. Try it out and then ask me any questions you have about it.
Wei Bin, the chief technology officer (CTO) of Puxiang Technology, is an open-source software enthusiast, the first certified Elastic engineer in China, the initiator of the Elastic Daily and ElasticTalk community projects, and the winner of the 2019 Annual Partner Architect Special Contribution award granted by Elasticsearch China. He has a wealth of practical experience in open-source software such as Elasticsearch, Kibana, Beats, Logstash, and Grafana, and has provided consulting and training services to customers in the retail, finance, insurance, securities, and technology industries. He helps customers locate, implement, and expand the use of open-source software in their actual businesses to produce value.
Declaration: This article is reproduced with authorization from Wei Bin, the author of the original article esrally as the Stress Test Solution for Elasticsearch. The author reserves the right to hold users legally liable in the case of unauthorized use.

2,593 posts | 794 followers
FollowAlibaba Cloud Product Launch - December 12, 2018
ApsaraDB - January 28, 2026
Alibaba Clouder - January 6, 2021
zcm_cathy - November 11, 2019
Alibaba Cloud Native Community - November 29, 2024
Alibaba Clouder - April 16, 2019

2,593 posts | 794 followers
Follow Big Data Consulting for Data Technology Solution
Alibaba Cloud provides big data consulting services to help enterprises leverage advanced data technology.
Learn More Big Data Consulting Services for Retail Solution
Alibaba Cloud experts provide retailers with a lightweight and customized big data consulting service to help you assess your big data maturity and plan your big data journey.
Learn More Alibaba Cloud Elasticsearch
Alibaba Cloud Elasticsearch helps users easy to build AI-powered search applications seamlessly integrated with large language models, and featuring for the enterprise: robust access control, security monitoring, and automatic updates.
Learn More Mobile Testing
Provides comprehensive quality assurance for the release of your apps.
Learn MoreMore Posts by Alibaba Clouder