Elastic Compute Service (ECS) is an elastically expandable computing service that can help you reduce IT costs and improve maintenance efficiency, so that you can concentrate on core business innovations. Alibaba Cloud conforms to strict Internet Data Center (IDC) standards, server access standards, and maintenance standards to provide reliable data, as well as a highly available cloud computing basic framework and ECSs.
However, you may still encounter system kernel crashes when using ECS instances. These kernel crashes, caused by incorrect operating system configuration, program overloading, or other reasons, can lead to problems such as system inaccessibility, abnormal reboot, or boot failure. To find the root cause and prevent such problems in the future, maintenance engineers need to check and analyze system logs. However, your ECS instances may fail to be properly connected through SSH, making it very difficult to locate the cause of the fault. This, fortunately, is no longer a problem because Alibaba Cloud has provided one-click system log view and screen capture features, allowing maintenance engineers to conveniently diagnose system faults and exceptions.
When ECS instances are down, reboot abnormally, or fail to boot, maintenance engineers need to locate the root cause of the problem, resolve the problem, and prevent it from happening in the future.
Faults affecting stable ECS instances mainly fall into two types:
For the first type of faults, Alibaba Cloud provides system event information for you to understand the impact of such faults on ECS instances. For the second type of faults, you need to check operating system logs to find the problem. These faults include operating system kernel bugs, incorrect system configuration, and program overloading. For more information about ECS system events, see System Events.
After related configuration is made on the Linux operating system, boot logs and information about faults and exceptions are printed through the servers' serial ports. For physical servers, maintenance engineers use Intelligent Platform Management Interface (IPMI) out-of-band interfaces to obtain the logs that the operating system prints through serial ports. For ECSs, maintenance engineers also need such logs to help diagnose faults and exceptions, so the ECS system serial port logs are important for maintenance and diagnosis.
The system uses serial ports to print two types of logs, namely, system boot logs and system kernel fault or exception logs.
| Log level | Name | Description |
| 0 | KERN_EMERG | The system is unusable. |
| 1 | KERN_ALERT | Actions that must be taken care of immediately. |
| 2 | KERN_CRIT | Critical conditions |
| 3 | KERN_ERR | Noncritical error conditions. |
| 4 | KERN_WARNING | Warning conditions that should be taken care of. |
| 5 | KERN_NOTICE | Normal, but significant events. |
| 6 | KERN_INFO | Informational messages that require no action. |
| 7 | KERN_DEBUG | Kernel debugging messages, output by the kernel if the developer enabled. |
On the ECS console, you can obtain the system logs of the ECS instances in the running state through the following operations in the instance list or on the instance details page.
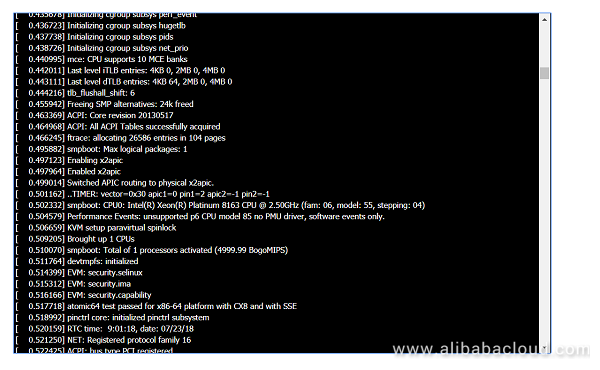
The following figure shows the boot logs generated when the system has booted successfully.

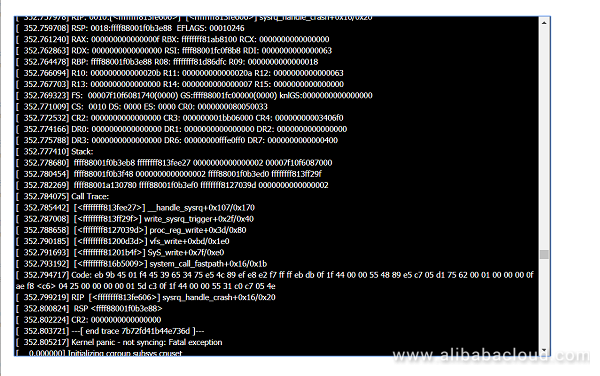
The following figure shows the error information generated when a kernel error occurs.

Maintenance engineers can use the log information to determine whether the system boot was successful and diagnose operating system exceptions and faults.
The system may also push exception information to a display (such as a blue screen on Windows) at certain times. However, ECSs are not connected to physical displays, so you can obtain instance screenshots to view the information pushed to the display when the exception occurred and analyze the problem accordingly.
You can call open APIs GetInstanceConsoleOutput to obtain the logs and GetInstanceScreenshot to obtain screenshots. Both are encoded in Base64 format.
Note that you can only check the system logs and screenshots of instances in the running state.
Alibaba Cloud Elastic Compute Service (ECS) provides proactive maintenance and system events to help you discover the impact of infrastructure faults and exceptions on ECS operation in advance. It also allows maintenance engineers to detect the faults and exceptions in time to take preventive measures to protect ongoing services. Moreover, the diagnostic log function introduced today can help maintenance engineers find the root causes of instance exceptions caused by operating system internal errors that can interrupt services and prevent the future occurrence of such problems.
The Alibaba Cloud ECS team is on a never-ending mission to make ECS better for our customers. We will be launching more maintenance tools and capabilities in the near future to give you a more reliable and visible ECS.
Alibaba Cloud Unveils ECS Core Technologies at LC3 Conference 2018
Best Practice on Testing System Event Processing Program for ECS Instances

33 posts | 12 followers
FollowAlibaba Cloud Native Community - March 25, 2024
yzq1989 - April 10, 2020
Alibaba Container Service - May 23, 2025
Alibaba Cloud Native Community - July 13, 2022
Xi Ning Wang - August 30, 2018
Alibaba Clouder - November 19, 2020

33 posts | 12 followers
Follow ECS(Elastic Compute Service)
Elastic and secure virtual cloud servers to cater all your cloud hosting needs.
Learn More Elastic High Performance Computing Solution
High Performance Computing (HPC) and AI technology helps scientific research institutions to perform viral gene sequencing, conduct new drug research and development, and shorten the research and development cycle.
Learn More Elastic High Performance Computing
A HPCaaS cloud platform providing an all-in-one high-performance public computing service
Learn More Container Compute Service (ACS)
A cloud computing service that provides container compute resources that comply with the container specifications of Kubernetes
Learn MoreMore Posts by Alibaba Cloud ECS